
Welcome to FanNation, Part of the Sports Illustrated Media Group
Find and follow your favorite team here. Get the latest news and updates about the team you care most about.
Nick Nurse Explains De’Anthony Melton’s Absence in Game 3 vs. Knicks
Despite getting cleared, De'Anthony Melton did not play for the Philadelphia 76ers in Game 3 against the Knicks.
Recent Articles
ESPN Ranks Kingsley Suamataia and Kedon Slovis as Some of the Best NFL Prospects Available at Their Positions
On Friday night, the second round of the NFL Draft kicks off in Detroit. Three BYU players were invited to the NFL Combine, and therefore, are candidates to be
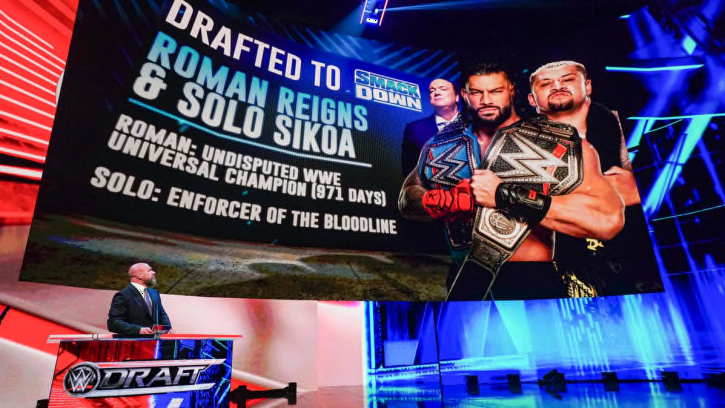
WWE Friday Night SmackDown Free Live Stream Results: WWE Draft 2024 Begins, The Bloodline Drama Continues
It's time for a special WWE Draft 2024 episode of Friday Night SmackDown. Also, Cody Rhodes & AJ Styles sign contracts for their WWE Backlash title match, and what is next with The Bloodline?

SEC Commissioner Greg Sankey Shoots Down College Football Super League Chatter
College football is in a flux of sorts thanks to all of the conference realignment and uncertainty around the country.
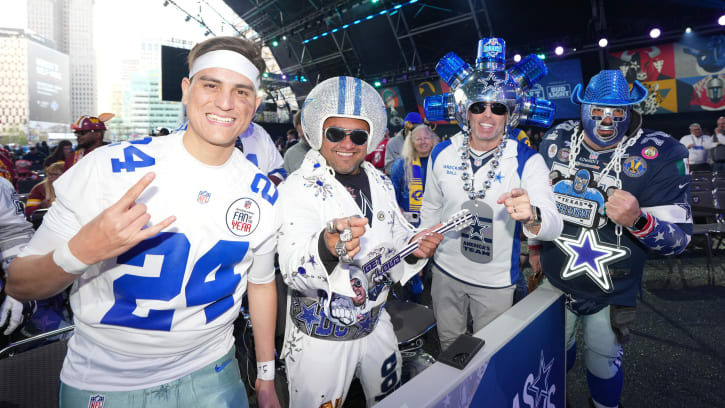
The Cowboys' Dilemma Between Acquiring Established Winners and Seeking Hidden Gems
The Cowboys have exceled in the draft, finding diamonds in the rough in every round over the last decade, yet it has led to little postseason success. Is it time to make a change to focus on proven players who have had major success in college?
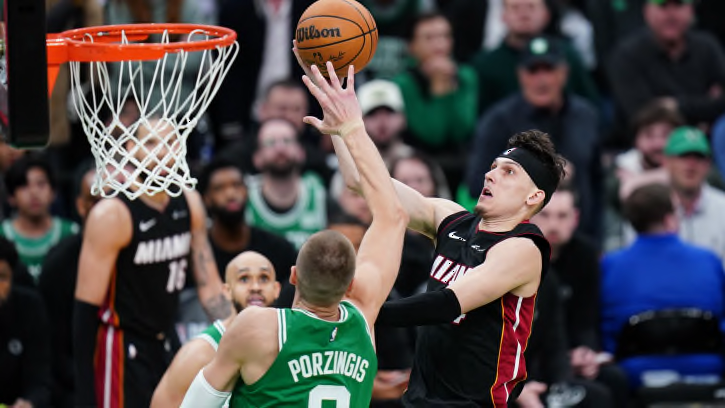
Stephen A. Smith 'Shocked' by Boston Celtics' Loss in Game 2 vs. Miami Heat
The Boston Celtics took a 111-101 loss to the Miami Heat in Game 2. Their first-round playoff series is now tied at 1-1. As captured by First Take, Stephen A.
Kings Gamble on French Project in 2024 Mock Draft
The Sacramento Kings could land a stud with the 13th pick in the draft.
Could Gavin Conticello be the Next D-backs Breakout Prospect?
The Diamondbacks 8th round pick from the 2021 draft seems to be putting it together with the bat at High-A Hillsboro.
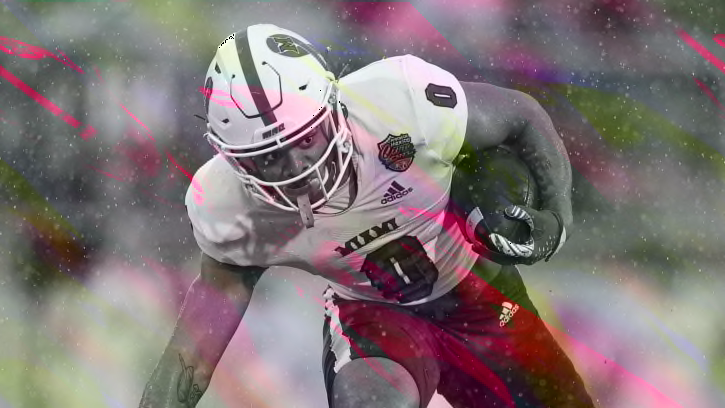
Mississippi State RB commit Rashad Amos transfers to Colorado
Former Miami (OH) rusher joins Coach Prime and the Buffs
Jaguars Podcast: Reviewing the Brian Thomas Jr. Selection
What do John and Gus make of the Jaguars' selection of Brian Thomas Jr. at No. 23?
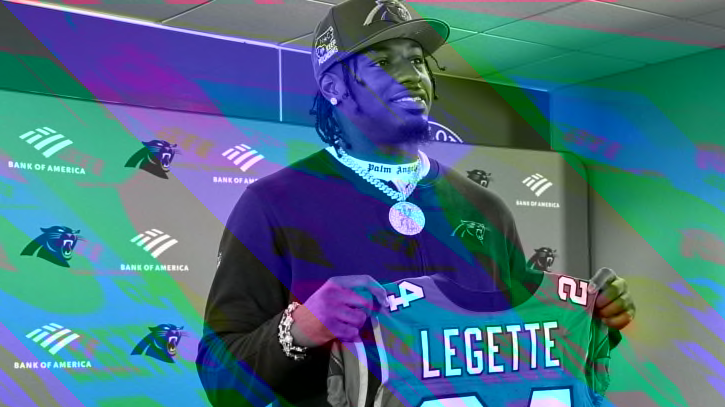
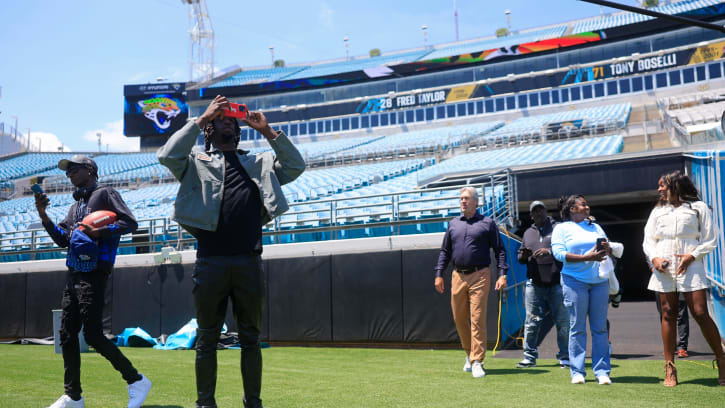
Inside Xavier Legette's Path to Becoming a Panther
The journey from being just a guy at South Carolina to becoming a first round pick.
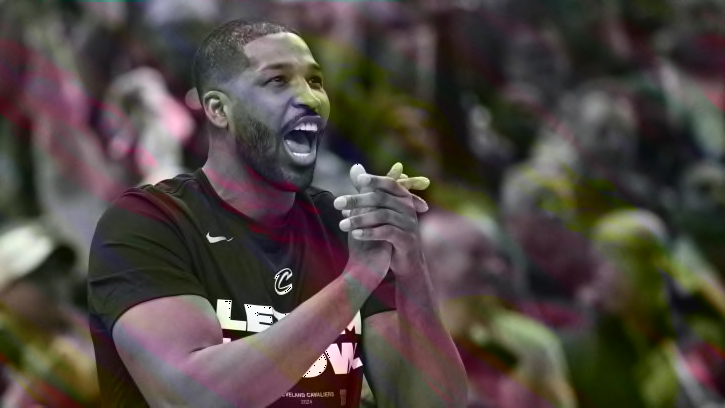
Cavs Veteran Offering "Brutal Honesty" To Team
Tristan Thompson continues to challenge the Cleveland Cavaliers throughout the NBA Playoffs and has been their voice of reason.
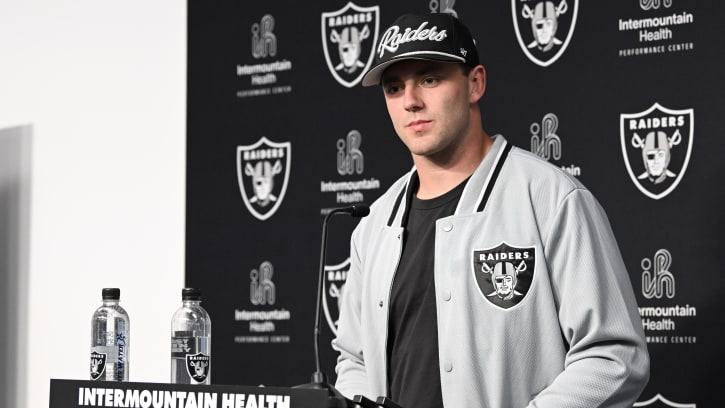
Las Vegas Raiders New TE Brock Bowers Formal Introductory Press Conference in Nevada
TE Brock Bowers, the Las Vegas Raiders' first-round draft pick, addressed the media today in Henderson, Nevada, and we have everything he said.
Nets Make Splash, Add Juwan Howard to Brooklyn Staff as Assistant Coach
Shortly after hiring Jordi Fernandez as the new coach of the Brooklyn Nets, Juwan Howard is now joining his staff as an assistant.
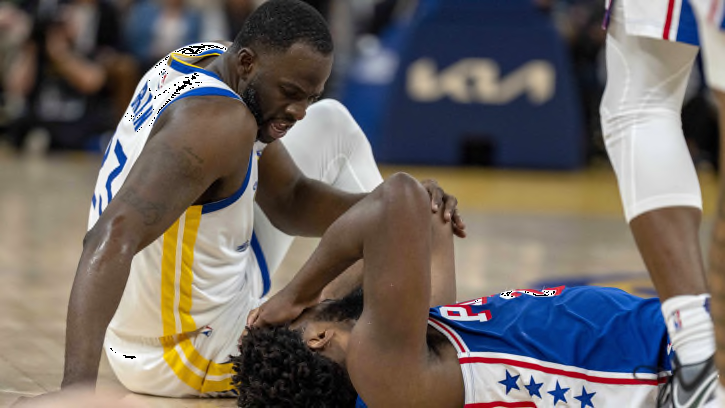
Draymond Green's Statement on Controversial Joel Embiid Play
Golden State Warriors forward Draymond Green was watching Knicks vs. 76ers
BREAKING: Michigan State WR Antonio Gates Jr. Withdraws From the Transfer Portal
Michigan State wide receiver Antonio Gates Jr. has withdrawn from the transfer portal less than a week after entering.
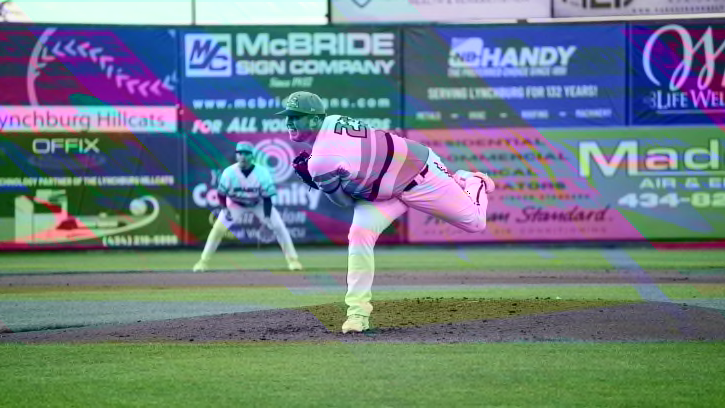
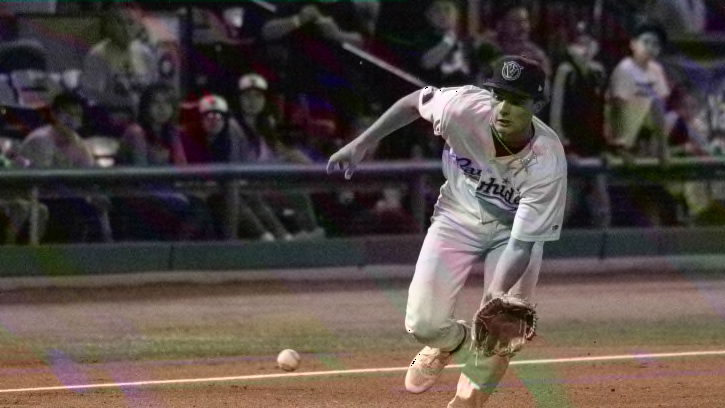
Guardians Minor League Pitcher Makes History With Legendary Performance
LHP Matt “Tugboat” Wilkinson, Cleveland’s 2023 10th-round pick, pitched six no-hit innings and threw 15 strikeouts for Single-A Lynchburg on Thursday night.
Indiana Pacers vs Milwaukee Bucks Game 3: Khris Middleton is in, final injury report, official starters April 26
The Pacers host the Bucks tonight
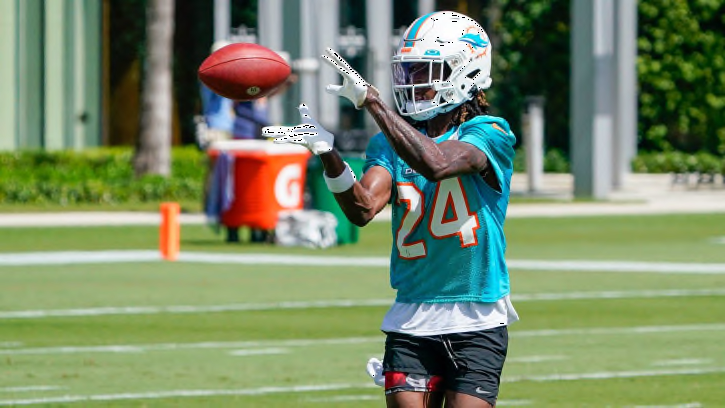
Setting the Stage for Round 2 of the Dolphins Draft
All the Miami Dolphins information you need to get ready for the 2024 NFL Draft

Washington Commanders Owner Josh Harris QB Jayden Daniels, 'It Was An Easy Pick'
Washington Commanders managing partner Josh Harris spoke about the selection of quarterback Jayden Daniels.
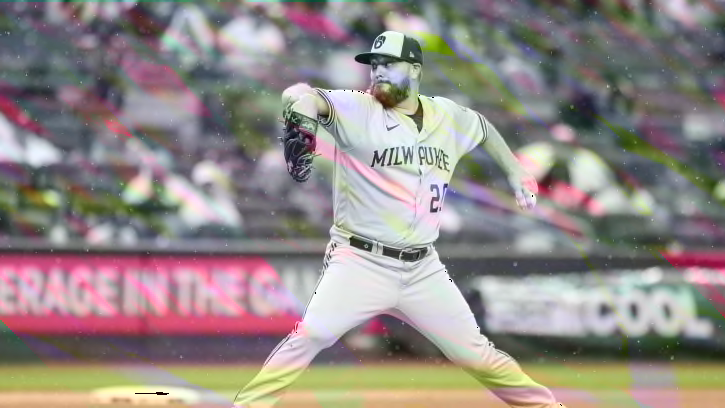
Milwaukee Brewers' Lefty Needs Tommy John Surgery, Putting Career in Doubt
After getting an MRI this week, it's been determined that Milwaukee Brewers' lefty Wade Miley needs Tommy John surgery. At 37 years old, he's set to miss the rest of this season and most or all of next season. This could very well put his career in doubt.
Official: Toby Okani Signs with West Virginia
The Mountaineers add guard Toby Okani
Pitt OT Predicted to Land With Chiefs
The Pitt Panthers' star tackle is projected to go late second round in the NFL Draft.

UFC News: Sean O'Malley Shares Timeline for Boxing Super Fight with Ryan Garcia
"Suga" believes he's one title defense away from squaring off with Garcia.
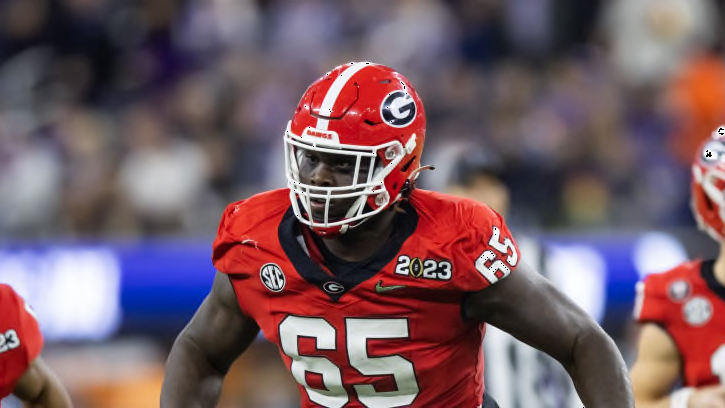
Amarius Mims Dives Into Play Style, Lack of Playing Time in College
Cincinnati introduced their atest first-round pick.