
Welcome to FanNation, Part of the Sports Illustrated Media Group
Find and follow your favorite team here. Get the latest news and updates about the team you care most about.
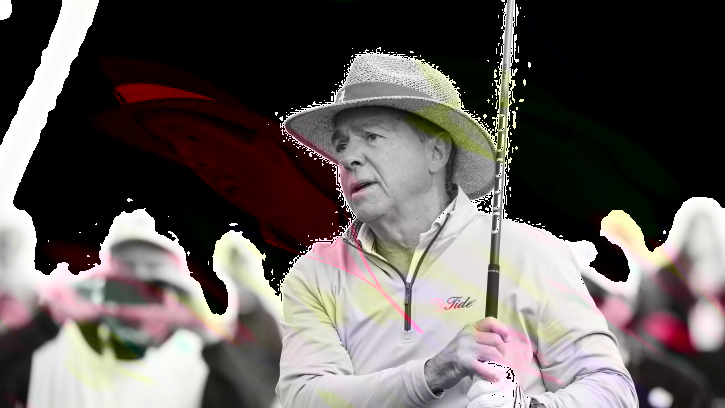
Nick Saban Raises Questions About Amarius Mims: 'Got to be a Little Bit More Consistent'
The legendary coach is doing draft coverage this weekend.
Recent Articles
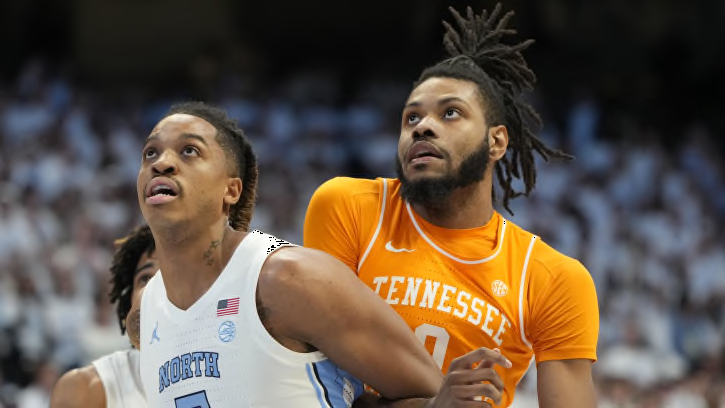
Encouraging Report: UNC Basketball to Host All-SEC Big Man Jonas Aidoo
With narratives constantly changing during transfer season, UNC basketball may still have a legit shot at landing Jonas Aidoo after all.
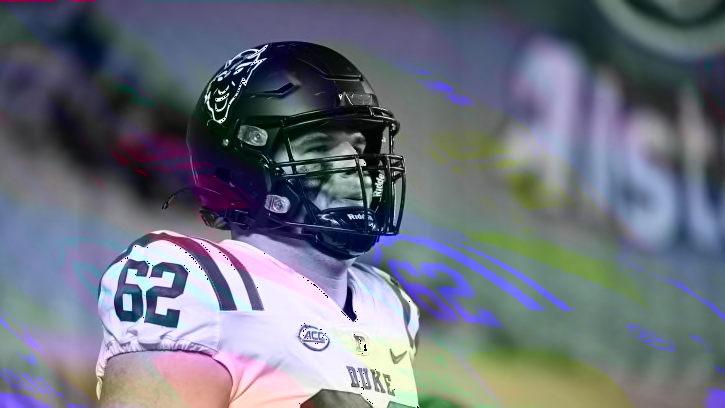
Graham Barton Becomes First Duke Football First-Rounder This Decade
Duke football standout offensive lineman Graham Barton will head to Florida to begin his pro career.
'We're Going to Be Best Friends': Arnold Discusses Top 30 Visit
Terrion Arnold was immediately challenged by Dan Campbell.
In Trading Up for J.J. McCarthy and Dallas Turner, the Vikings Swung For the Fences
The Vikings had a bold first night of the NFL draft. It'll be fascinating to see if it pays off.
Grading the Packers’ 2024 NFL Draft Picks
From Round 1 through Round 7, we will grade every Green Bay Packers draft pick.
Ryan Poles Sets Up His Air Show and Isn't Looking Back
Analysis: The selection of Caleb Williams and Rome Oduzne lets the Bears boast a destructive passing game but there are defensive needs still to address.
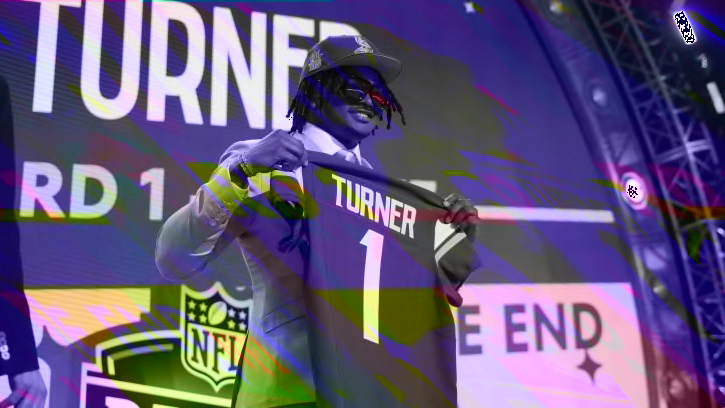
Vikings Draft Grades: What Do Analysts Think of J.J. McCarthy, Dallas Turner Picks?
The Vikings made quite the splash in the first round of this year's draft.

Las Vegas Raiders Insider Podcast Recapping Day One of the 2024 NFL Draft
Our latest episode of the Las Vegas Raiders Insider Podcast recaps day one of the 2024 NFL Draft and all that went into it and came out of it.
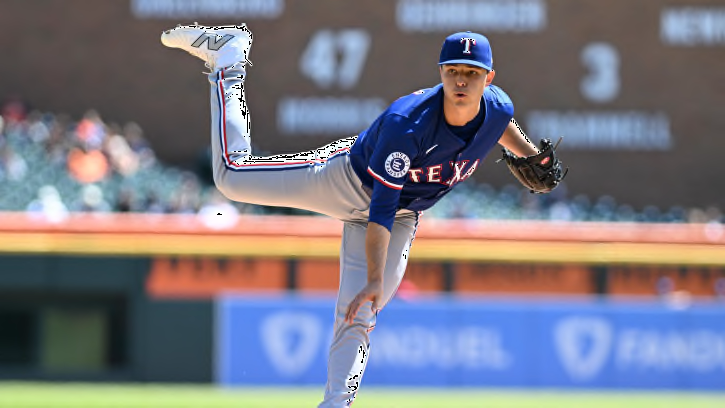
Back In Round Rock, Texas Rangers Star Pitching Prospect Jack Leiter Keeps K's Coming
In his first start since his MLB debut, Jack Leiter struck out eight and held Salt Lake to one hit over six innings Thursday for Triple-A Round Rock.
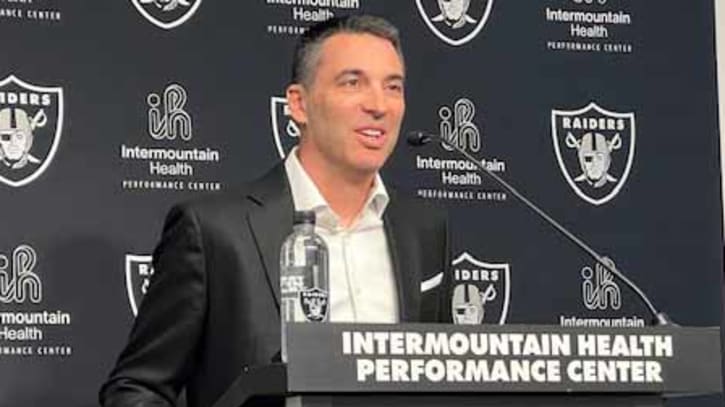
Las Vegas Raiders GM Tom Telesco's Entire Round One Post NFL Draft Press Conference
Las Vegas Raiders General Manager Tom Telesco finished his first day of the NFL Draft leading hte Silver and Black, and we have his entire press conference afterward for you to enjoy.
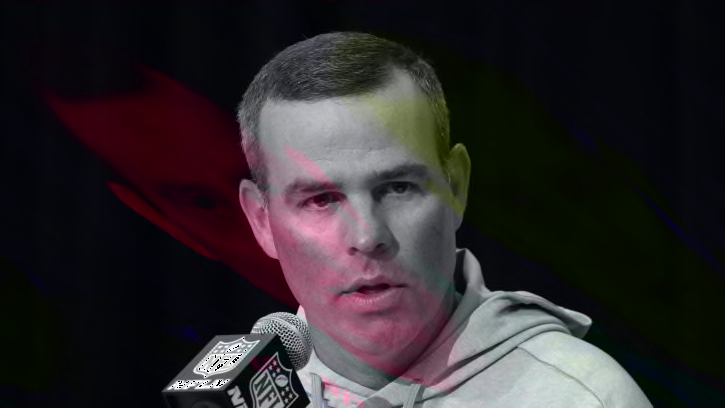
NFL Draft: GM Brandon Beane Explains Why Buffalo Bills Abandoned Round 1
The Buffalo Bills traded out of the first round at the NFL Draft on Thursday night, but added two Day 2 picks in the process.
Here Are Day 2 Draft Fits for Packers After Picking Jordan Morgan
Focusing on the team’s biggest needs, here are many of the top players who remain available entering Friday’s second and third rounds.
Brett Veach Explains Trade Rationale, Excitement for Xavier Worthy
Fresh out of the first round, Veach discussed why Kansas City moved up for Worthy and how he can help the Chiefs' offense.
Indiana Pacers vs Milwaukee Bucks Game 3 preview: Start time, where to watch, injury report, betting odds April 26
The Pacers and Bucks keep their series rolling tonight
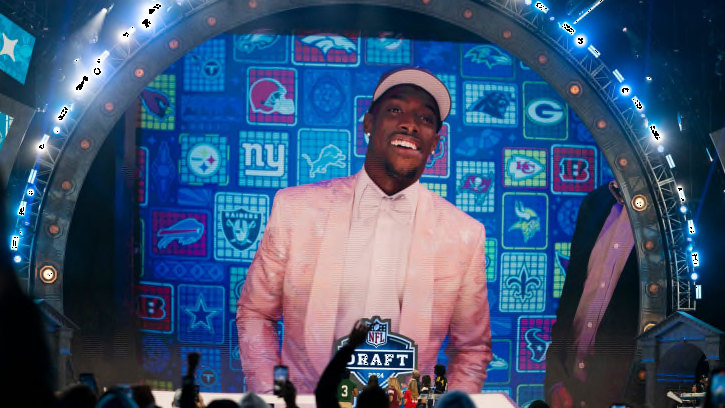
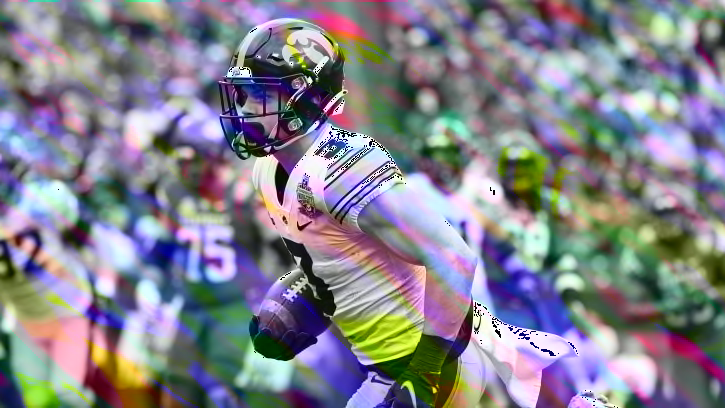
From Fan to First-Round Pick, Byron Murphy Ecstatic to Join Seattle Seahawks
After enjoying the "Legion of Boom" while in middle school and high school, Byron Murphy will now proudly sport Seattle Seahawks navy and action green with a chance to play a key role in re-establishing their defense as one of the NFL's best.
What They're Saying: Pundits Applaud Lions' Pick of Terrion Arnold
Lions' trade for Terrion Arnold draws rave reviews.
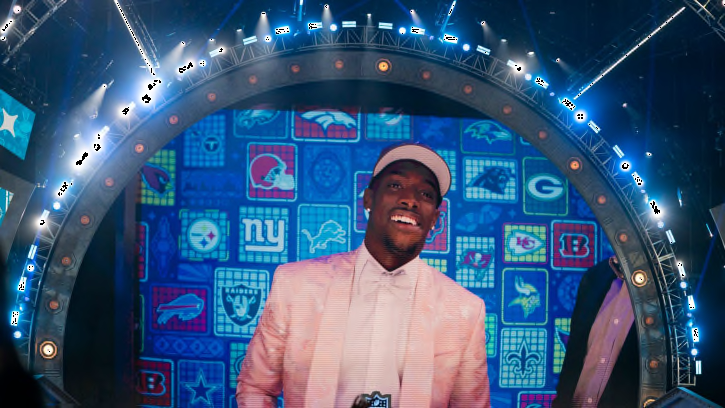
Malik Nabers Ready to Bring “Dog Mentality” to the Giants
Malik Nabers can't wait to get to work with his new Giants teammates.
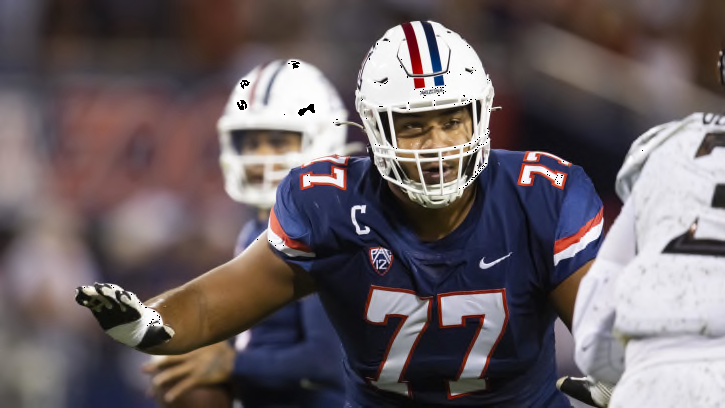
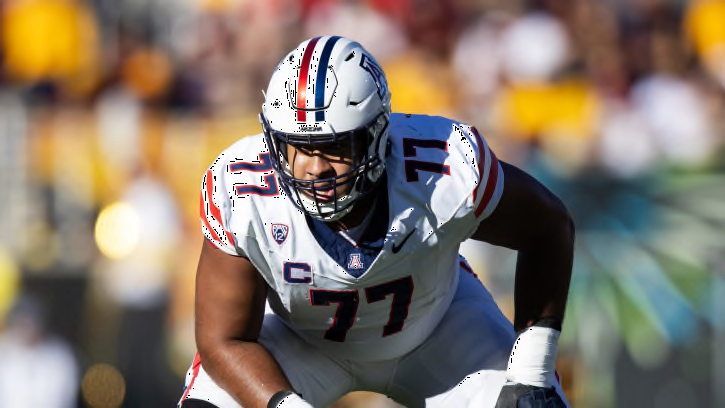
Gutekunst Dismisses Morgan’s Short Story
The Green Bay Packers used their first-round pick in the 2024 NFL Draft on Arizona left tackle Jordan Morgan. Here’s what GM Brian Gutekunst had to say about him.
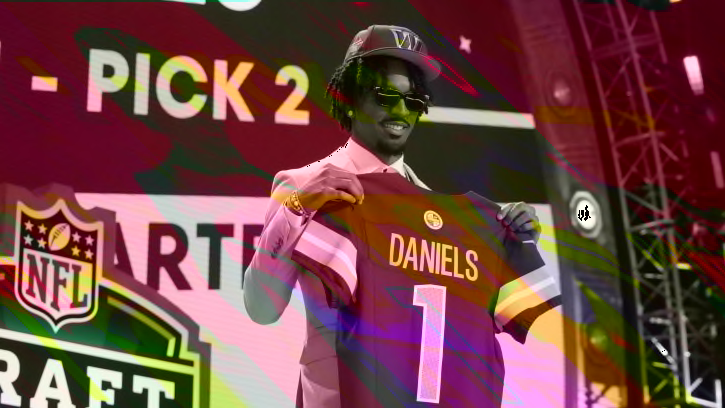
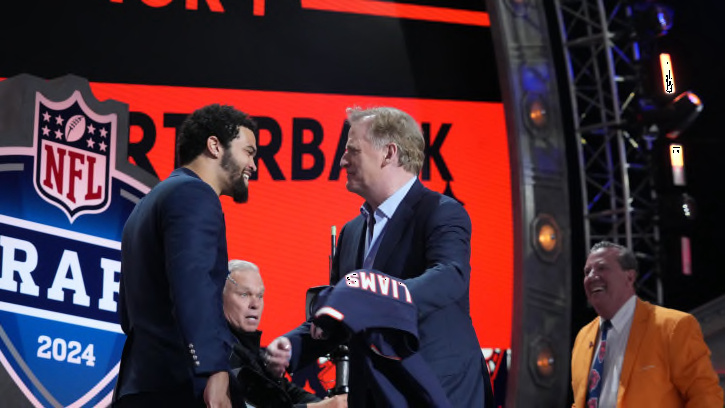
Washington Commanders GM Adam Peters: 'We Knew It Was Jayden For A While'
Washington's GM opens up about the selection of the Commanders' quarterback of the future.
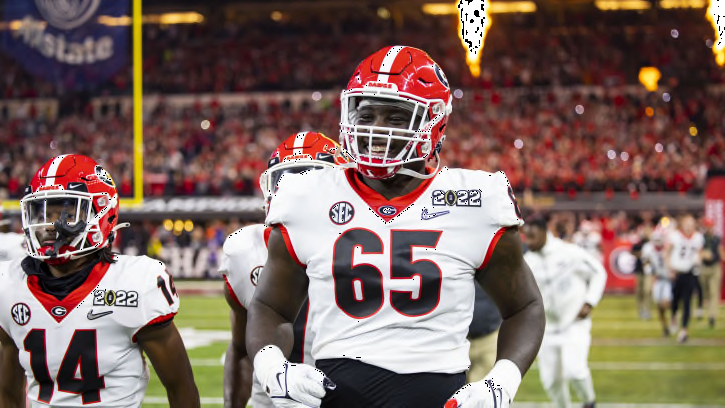
Cincinnati Bengals Make Right Decision, Take Amarius Mims in First Round of 2024 NFL Draft
Cincinnati took Amarius Mims with the No. 18 pick.
Projecting the Panthers Day Two Picks Following Round 1
What will Carolina do in the second and third rounds of the 2024 NFL Draft?
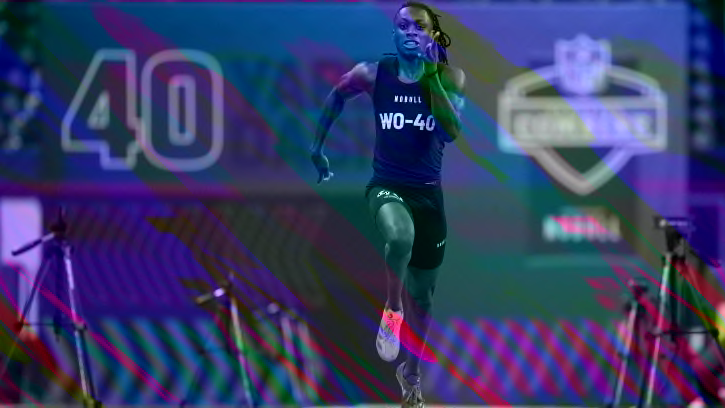
Andy Reid On Chiefs Adding 'Heck of a Football Player' Xavier Worthy
Speaking to the media on Thursday night, Reid addressed Kansas City's newest wideout addition.
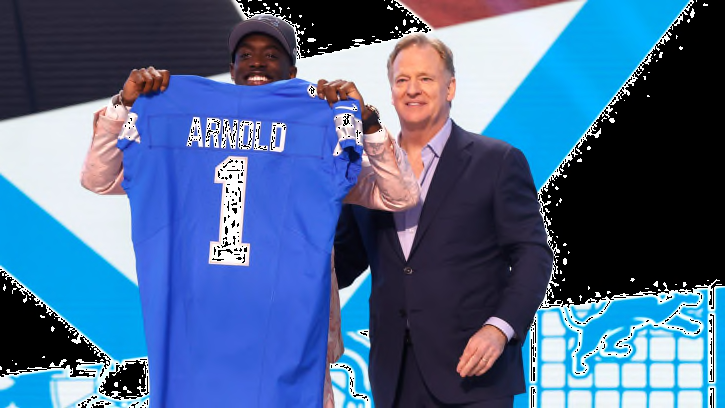
New CB Terrion Arnold Fits Lions 'Like a Glove'
Arnold appears to be ideal fit for Lions' culture.