
Welcome to FanNation, Part of the Sports Illustrated Media Group
Find and follow your favorite team here. Get the latest news and updates about the team you care most about.
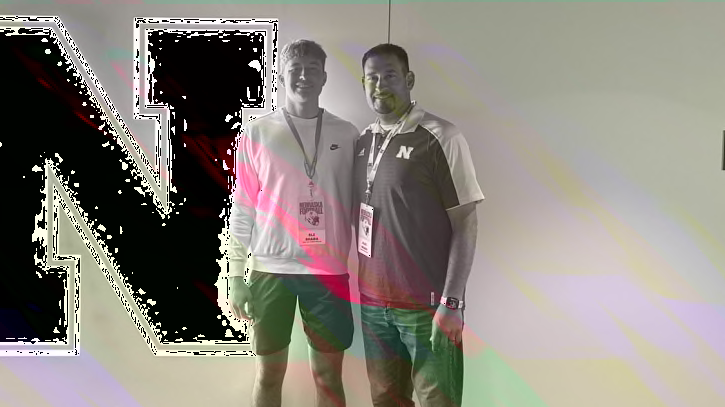
2026 Lineman Eli Shada Discusses Husker Visit
Intensity of practice stood out to in-state prospect
Recent Articles
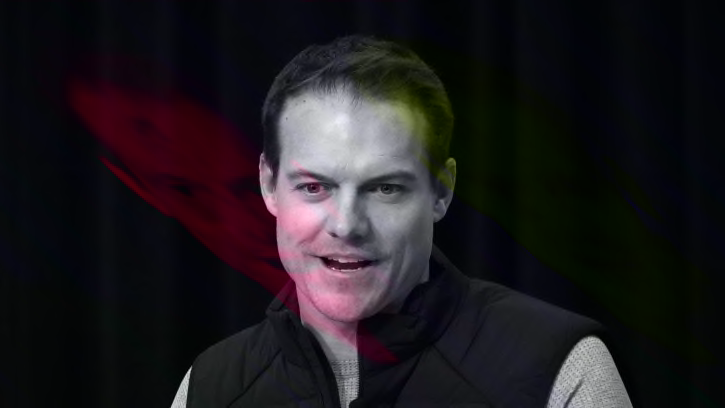
Kevin O'Connell Gives Great Answer to Draft Question at Church Event
Being an NFL head coach means getting asked about quarterback footwork at church.
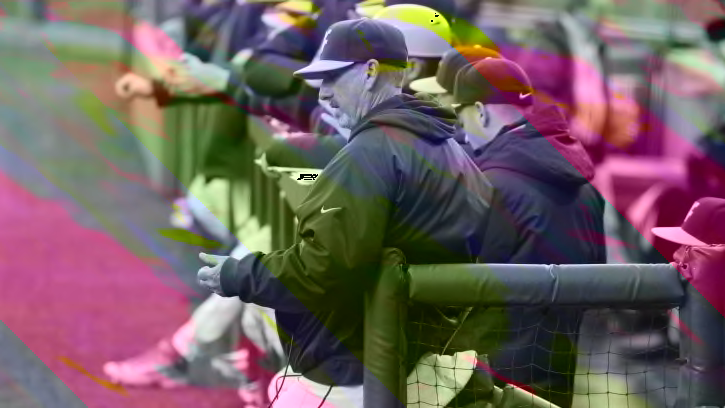
Mountaineers Hammered in Lubbock
Austin Green leads Texas Tech with five RBS to crush West Virginia in game one
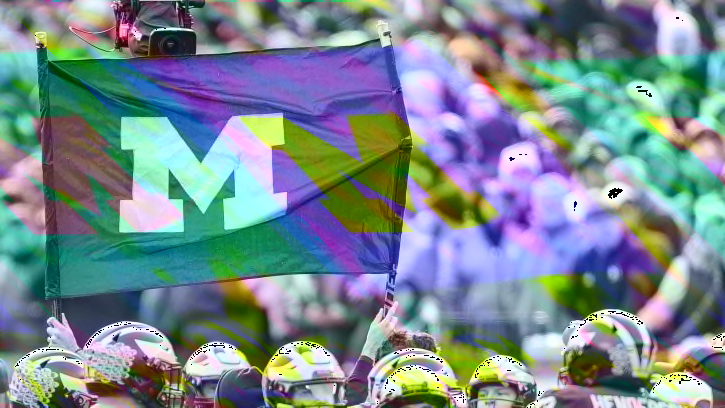
Michigan Football: Spring Game Rosters Unveiled
Michigan will hold its annual spring game tomorrow in the traditional Blue vs. Maize format and here are the rosters. Who ya got?!
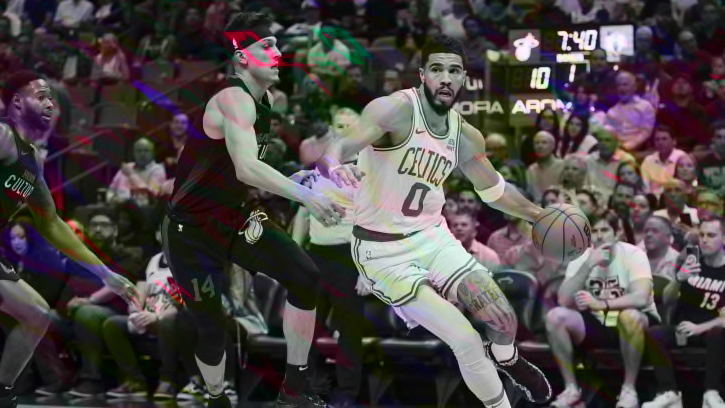
Heat Best Bulls, Continuing NBA's Most Common Playoff Series Since 2010
After the Miami Heat knocked off the Chicago Bulls 112-91 in the play-in tournament, the Boston Celtics and Miami Heat will square off in the playoffs for the fourth time in the last five years.
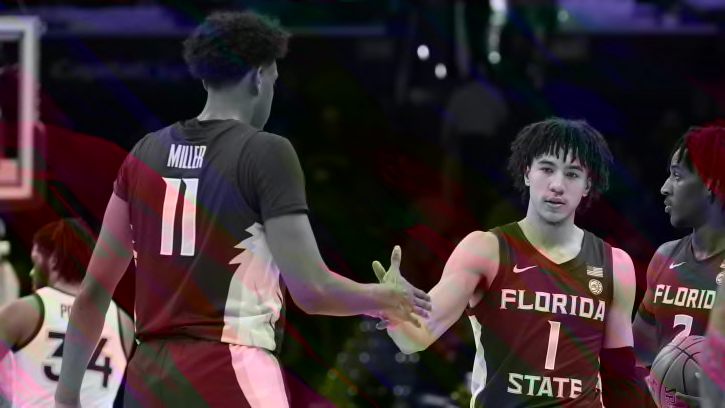
Key FSU Basketball Starter Is Entering NCAA Transfer Portal
The Seminoles have had six players move on from the program since the conclusion of the season.
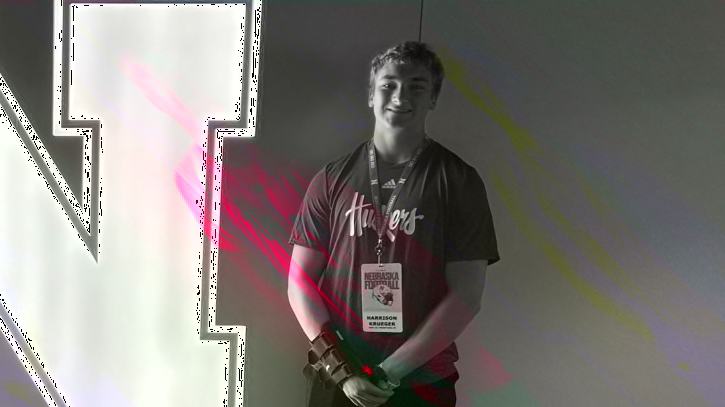
Nebraska Visit Was an ‘Unreal’ Experience for Edge Defender Harrison Krueger
‘It's been a dream of mine to play for the Huskers my whole life,’ says 2026 in-state prospect

Ole Miss Rebels Commit 4 Errors, Run-Ruled in Series Opener by Georgia Bulldogs
The Ole Miss Rebels did not play pristine baseball en route to a series-opening loss on Friday night.
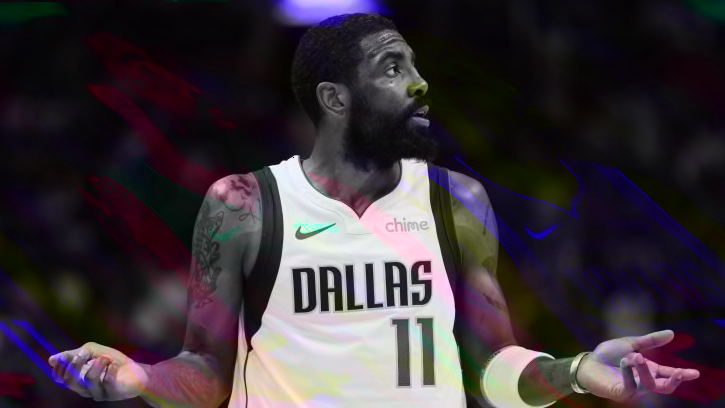
Kyrie Irving’s Statement Before Clippers vs. Mavericks
Kyrie Irving revealed his approach to Game 1.

In-State 2026 Athlete Landon Fye Recaps Nebraska Visit
Speedy WR/DB from nearby Wahoo impressed by Huskers' staff and facilities
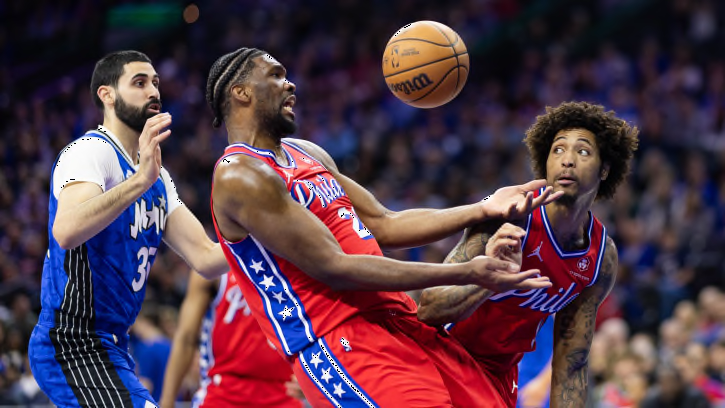
Philly Celebrity Praises Sixers Before Playoff Series vs. Knicks
The Philadelphia 76ers picked up a critical win on Wednesday to draw a first-round series against the New York Knicks.
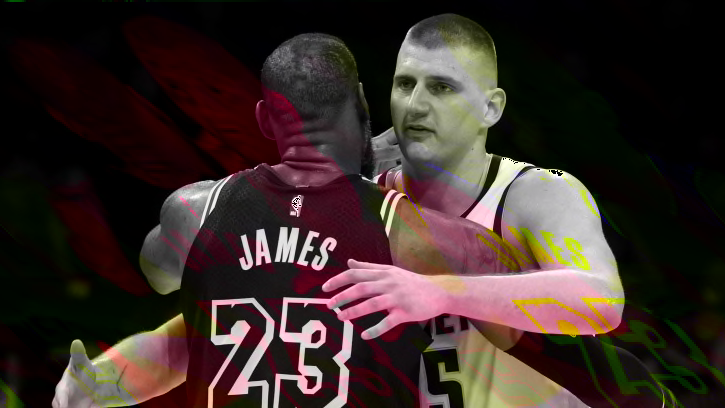
LeBron James' Strong Nikola Jokic Statement Before Lakers vs. Nuggets
The Los Angeles Lakers are set to battle the Denver Nuggets

2024 NBA Draft: Are We Overthinking Who's Going No. 1?
French center Alexandre Sarr has kept his name near the top of the draft all season long.
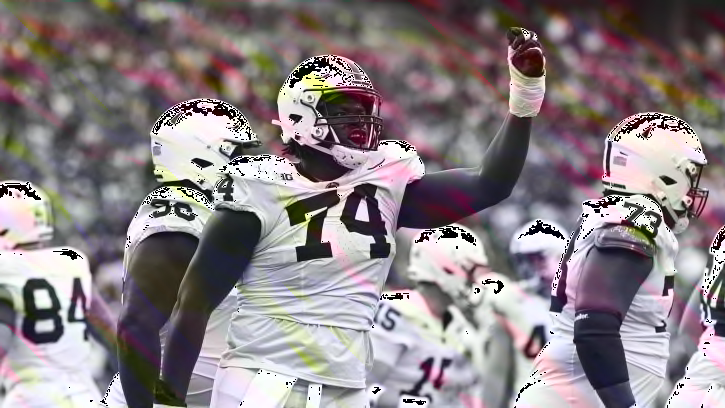
Giants Go Offensive Line in PFN's Latest Mock Draft
Pro Football Network has the Giants selecting their third first-round offensive tackle in the last four seasons.
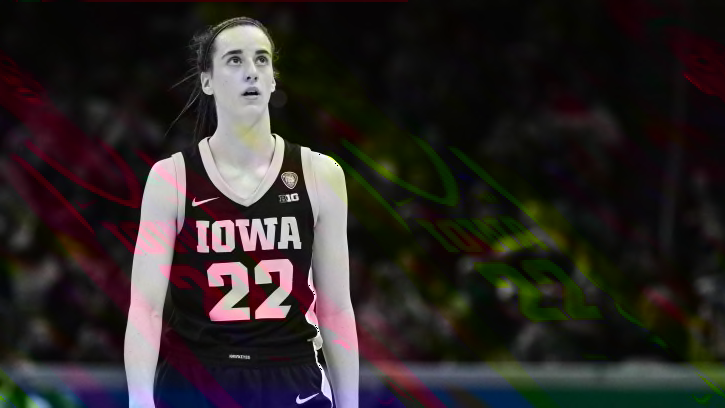
Former NBA Player Reacts to Caitlin Clark's Massive Nike Deal
Caitlin Clark has a massive deal with Nike that includes a signature shoe
UNC Basketball Looks Like Leader in Key Transfer Sweepstakes
The UNC basketball coaches might be closing in on a commitment from former Belmont star and North Carolina native Cade Tyson.
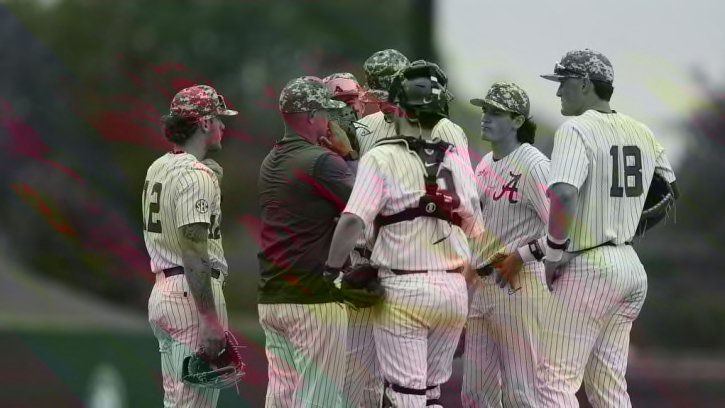
Alabama Baseball Swept in Doubleheader by No. 1 Texas A&M, Dropping Series
Friday's doubleheader did not bring the desired result for the No. 18 Alabama baseball team.
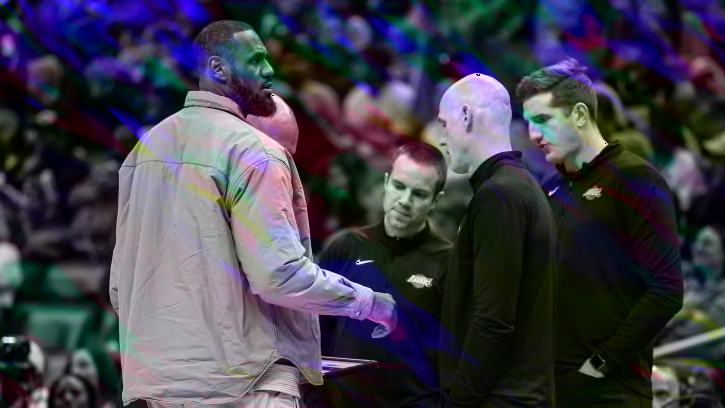
Darvin Ham Gives Injury Update on Key Lakers Player
The Lakers have some key players injured against the Nuggets.
Rockets’ 2024 Nets Pick has Ninth-Best Lottery Odds
Houston will again select in the lottery of the NBA Draft.
Blake Griffin's Honest Statement on Detroit Pistons Fans
Blake Griffin still gets some love from Detroit fans
Predictions Pile Up for Duke Basketball in Major Transfer Races
Duke basketball is now the outright frontrunner for a pair of forwards in the portal.
NBA Media Personality Makes Strong Case For Shai Gilgeous-Alexander as MVP
It feels like SGA is on the outside looking in, but he should have a strong case for MVP this season.
UW's Banks Enters Transfer Portal, Seeking Better Luck at Cornerback
The defensive back had back-to-back season-ending injuries for the Huskies.

Jordan Montgomery to Make Diamondbacks Debut in San Francisco
The Diamondbacks' prized free agent signing will make his long-awaited debut Friday night against the San Francisco Giants.
James Wiseman Reflects on Growth During Detroit Pistons Tenure
Detroit Pistons big man James Wiseman recently spoke on his growth throughout the 2023-2024 NBA season.