
Welcome to FanNation, Part of the Sports Illustrated Media Group
Find and follow your favorite team here. Get the latest news and updates about the team you care most about.

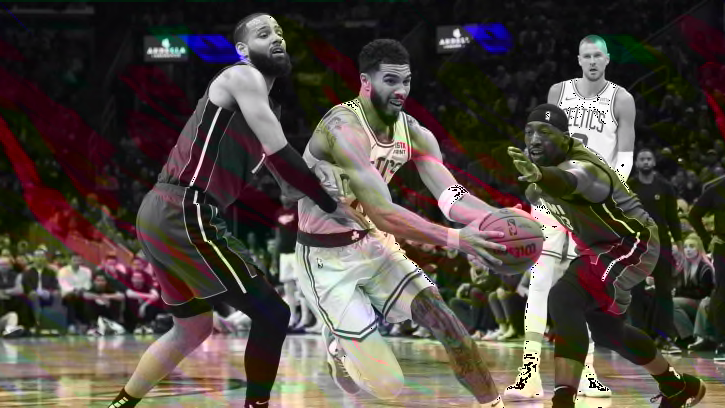
Celtics Center Sidelined for Second Straight Game vs. Heat
On Wednesday night at TD Garden, the Boston Celtics aim to take a commanding 2-0 lead in their first-round series against the Miami Heat. But they'll have to do so without a valuable option at center.
Recent Articles
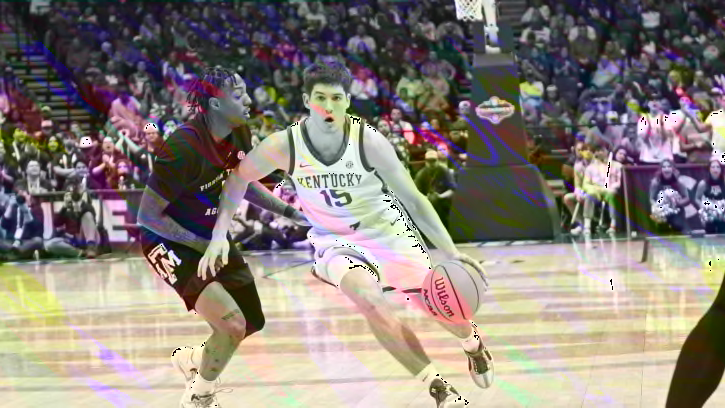
Latest NBA Mock Pegs Jazz as Spot for Sharpshooter Out of Kentucky
The Utah Jazz could use some more perimeter shooting heading into next season.
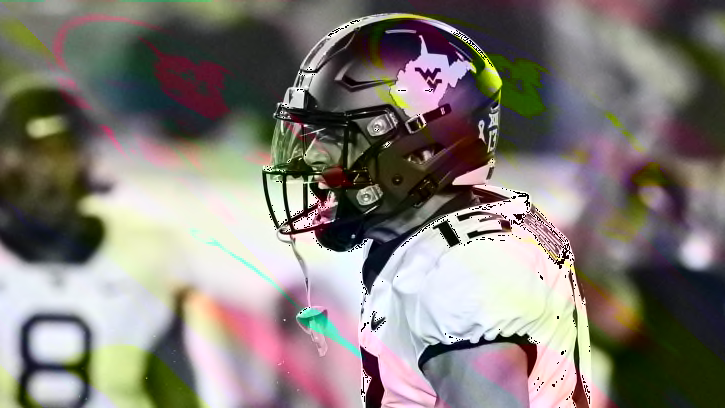
West Virginia Wide Receiver Enters Transfer Portal
The Mountaineers lose a depth piece to the portal.

Watch Arizona Cardinals GM Monti Ossenfort's Intense War Room Footage From Draft Day 2023
The Cardinals made several draft 2023 day trades, wheeling and dealing on draft day, in an attempt to maneuver and increase their picks.

Beisel Takes the Lead, Plus More Prairie Circuit Standings
Emily Beisel is currently leading the Prairie Circuit standings with just one rodeo on her count, and the rest of the field is hot on her heels, with only $20 separating Beisel and the No. 2 cowgirl.
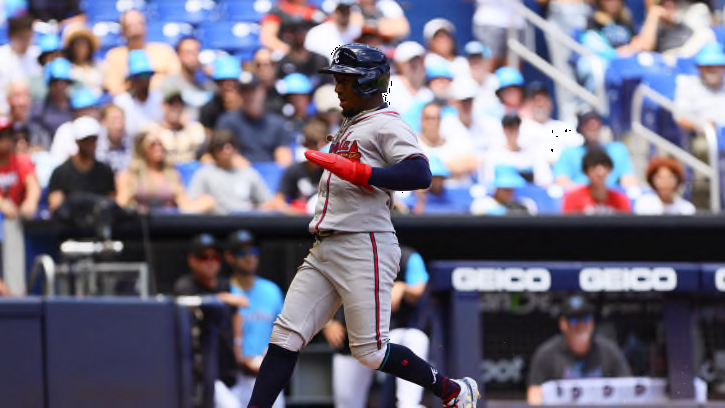
Braves Could See Star Return From Injury As Soon As This Friday
The Atlanta Braves might get back a key contributor a lot sooner than expected.

Could Ravens Trade Later in NFL Draft?
The Baltimore Ravens have just three picks in the Top 100, but could that change in the 2024 NFL Draft?
Heat's Caleb Martin Says He 'Doesn't Need to Take Out Guys' to Beat Celtics
Miami Heat forward Caleb Martin further discussed his hard foul on Boston Celtics star Jayson Tatum.
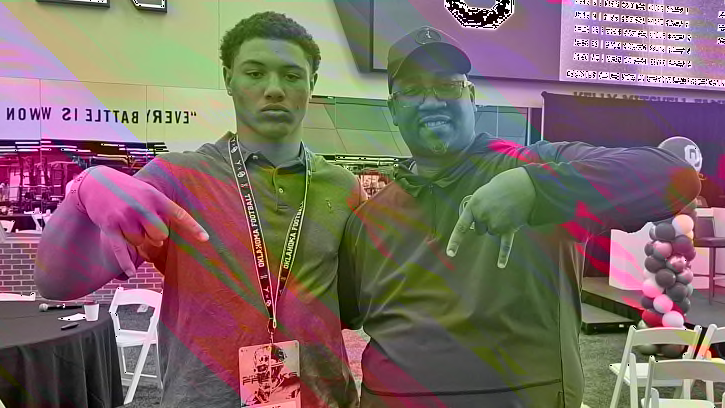
How Recruiting Came Early and Ended Quickly for Oklahoma Commit Zane Rowe
As he embraces the hard work, OU's first 2027 commit acknowledges other schools will continue to come after him in the coming years, but says "I’m bleeding the OU DNA."

Seattle Mariners Activate Reliever Collin Snider, Option Him to Triple-A
As the Seattle Mariners get set to open up a big series against the Texas Rangers on Tuesday, they have activated pitcher Collin Snider from the injured list. They have optioned him to Triple-A, however.
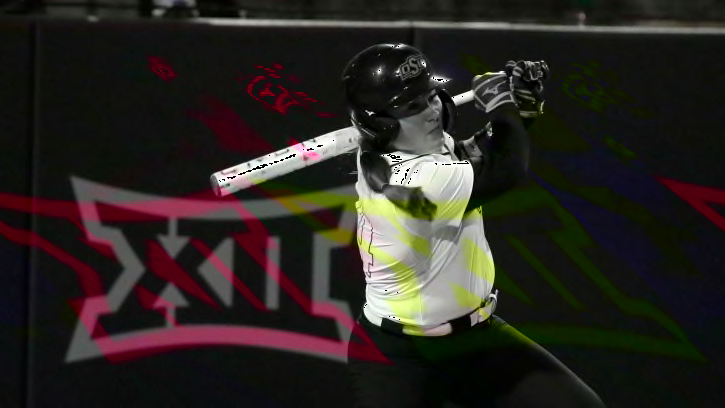
Oklahoma State Softball Notebook: Weekend Review (4/22)
The Cowgirls picked up the series sweep over the weekend, taking down Texas Tech.
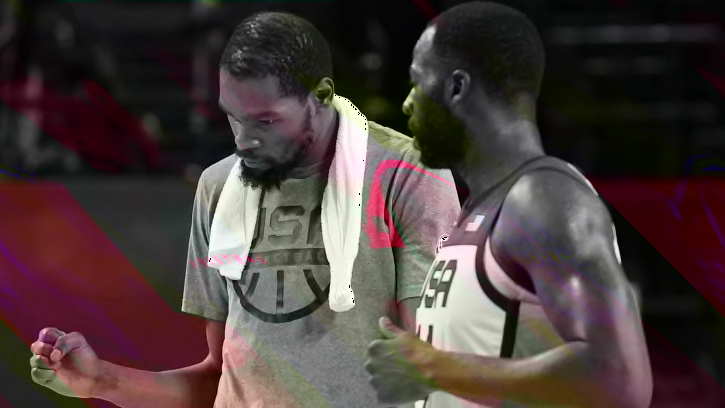
Draymond Green Says Suns Must Do This vs T-Wolves
The Phoenix Suns must put Kevin Durant on Anthony Edwards, according to Draymond Green.
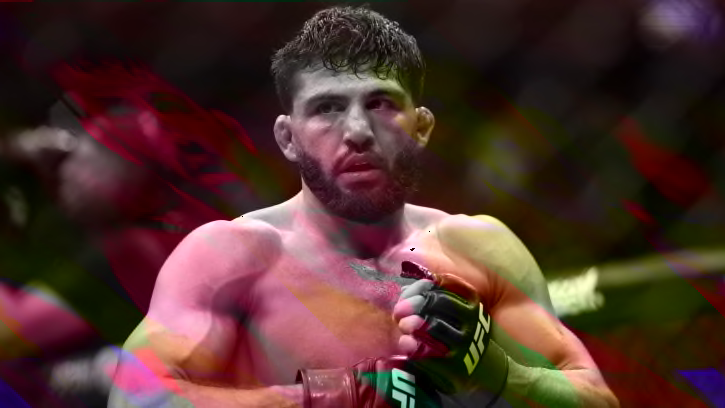
Arman Tsarukyan Counters Michael Chandler Over Missed UFC Title Shot, Islam Makhachev ‘Not Surprised'
UFC Lightweight Champion Islam Makhachev weighs in on Tsarukyan turning down a title fight.

San Francisco Giants Unveil Electric Light Show For Their Elite Closer
After rumors swirled about what the San Francisco Giants' new lights might look like when their closer enters the game, they finally were able to unveil it and the feedback was fantastic.
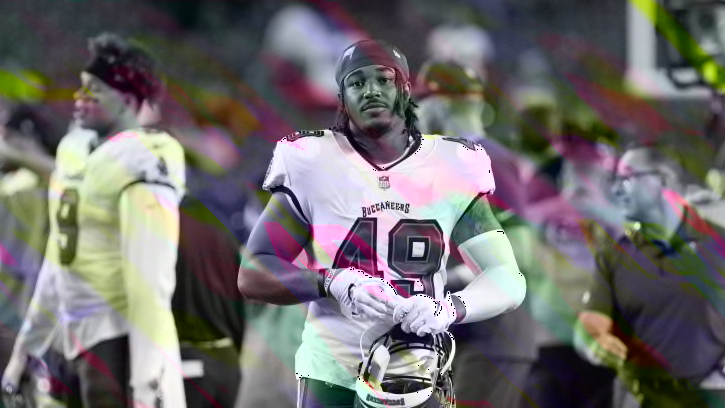
Patriots Host Former Buccaneers LB for Workout Ahead of NFL Draft
The New England Patriots could add some depth on the defensive side of the ball before Thursday's draft.
Top Target Or Off The Board? The Importance Of The Eagles' Medical Staff
Talk about extremes. UCLA's Laiatu Latu may be the Eagles' top target on Thursday night or he could be wiped from the organization's board.
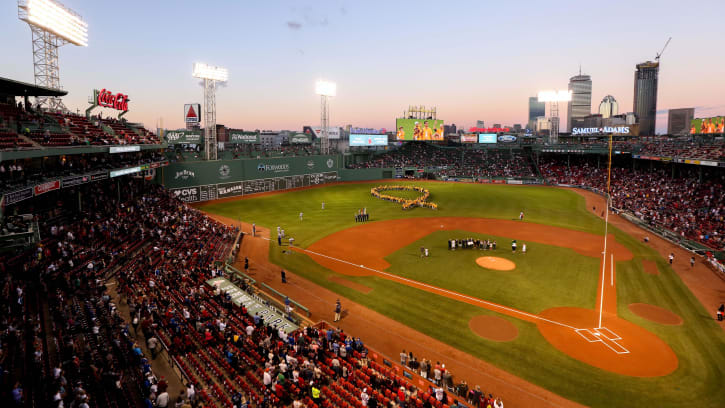
Red Sox Insider Links Former Cubs Slugger As Possible Target For Boston
Boston could use some help after dealing with injuries
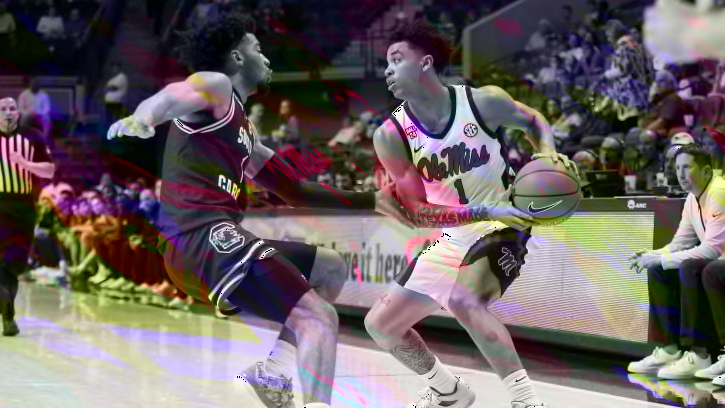
Rebels Guard Austin Nunez Enters Transfer Portal, Per Report
Chris Beard and the Ole Miss Rebels are reportedly losing a guard to the transfer portal.
Notre Dame Impresses IMG Defensive End Elijah Golden
Notre Dame hosted Florida DE Elijah Golden for a visit and the Irish staff made a strong first impression
Report: Steelers Working on Draft Trade With Broncos
The Pittsburgh Steelers are working on a blockbuster trade for a star defender.
Marlins Prepare to Face Max Fried in Atlanta's Truist Park on Tuesday
The Miami Marlins are preparing to take on Atlanta's top lefty for the 14th time - here's the lineups and how to watch
Michigan State Gymnast Schulte Earns All-America Honors at NCAA Championships
Michigan State's Skyla Schulte and Nikki Smith concluded the Spartans' gymnastics season at the NCAA Championships.
Who Do Vikings Select in Conor Orr's New Mock Draft?
The Vikings trade up for a quarterback in this mock, but which one?
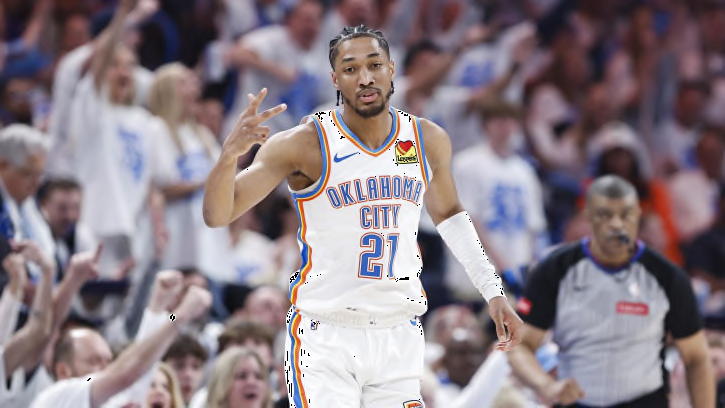
Mark Daigneault Has a Method to His Rotational Madness in OKC Thunder Playoff Game
The Oklahoma City Thunder have done things unconventionally since Mark Daigneault arrived as the Thunder bench boss. Including during Sunday's playoff game. There is a reason for that.
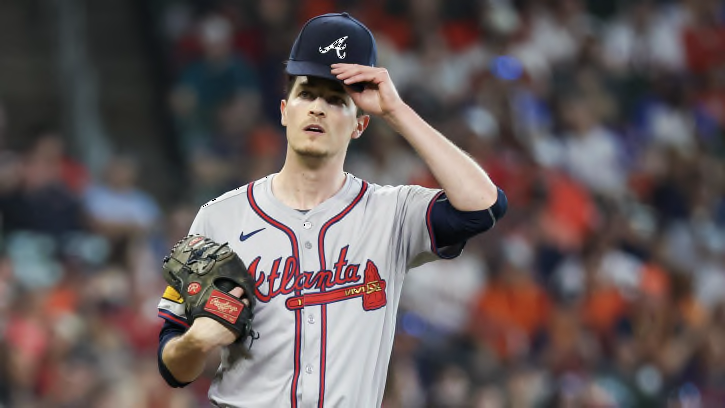
Braves & Marlins Set For Lefty Pitching Duel in Truist Park on Tuesday Night
The Atlanta Braves are sending Max Fried to the mound tonight; here's the lineups and how to watch