
Welcome to FanNation, Part of the Sports Illustrated Media Group
Find and follow your favorite team here. Get the latest news and updates about the team you care most about.
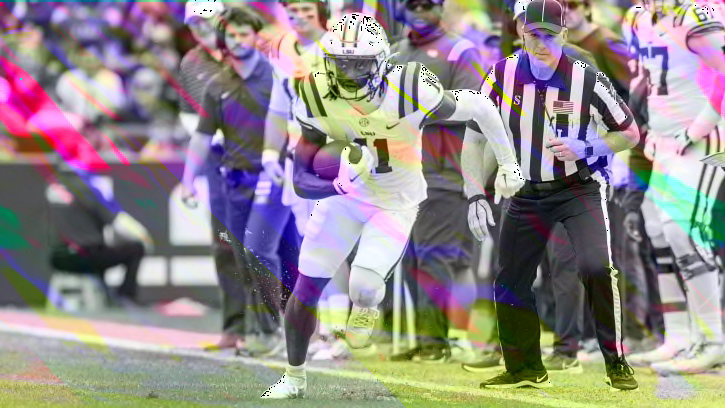
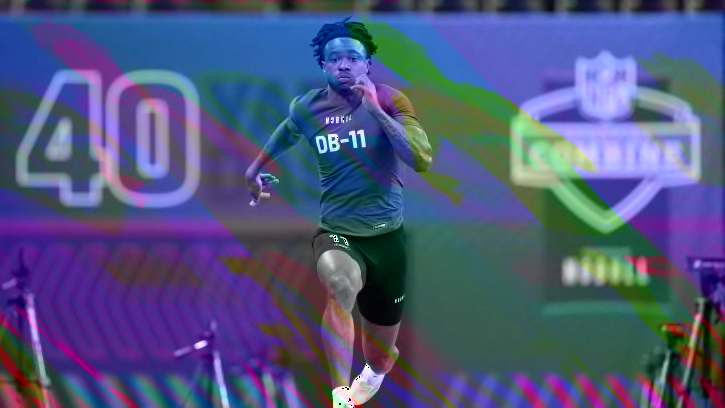
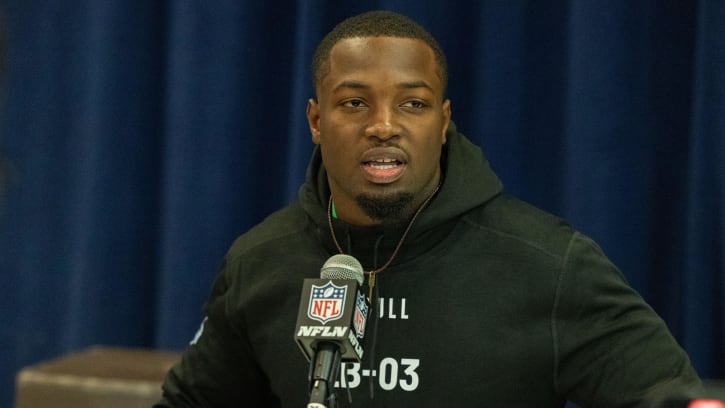
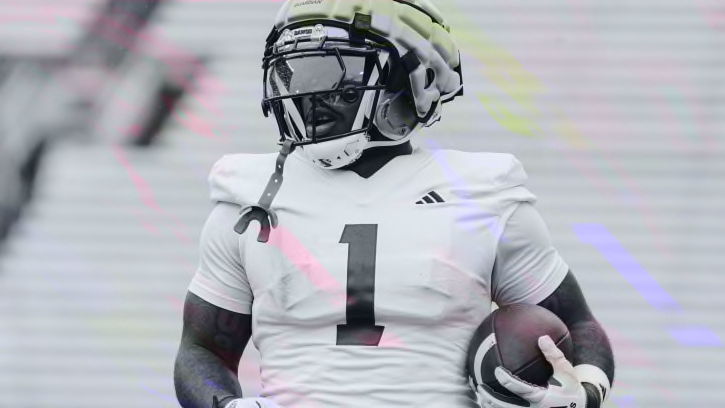
LSU WR Brian Thomas Jr. Has Received Medical Red Flags
Brian Thomas Jr. has been viewed by many as a first round pick. Will he still go in round one after medical concerns were raised?
Recent Articles
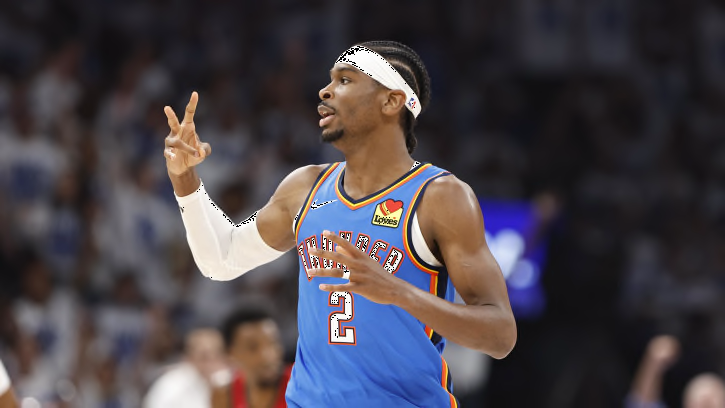
Social Media Reacts: OKC Thunder Earns Commanding Series Lead Over Pelicans
The Oklahoma City Thunder earned a commanding 2-0 series lead over the New Orleans Pelicans as the offense comes alive.
Chet Holmgren Heats Up, Shai Gilgeous-Alexander Anchors in Commanding Game 2 Win
In arguably the best outing of Holmgren's young career, he led the Thunder en route to its second win in the opening round on Wednesday.
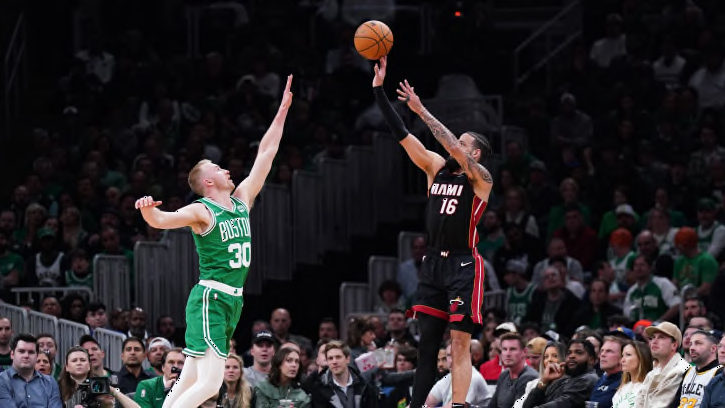
Heat's Historic Shooting Leaves Celtics Contemplating: 'We Gotta Respond'
Despite a roster that's not considered to have many shooters that instill fear into the opposition, the Heat buried a franchise record 23 threes in their Game 2 win over the Celtics.
Seminole Legend Jameis Winston Reveals His 'Ultimate' FSU Football Offense
Which skill position players land on Winston's ultimate offense?
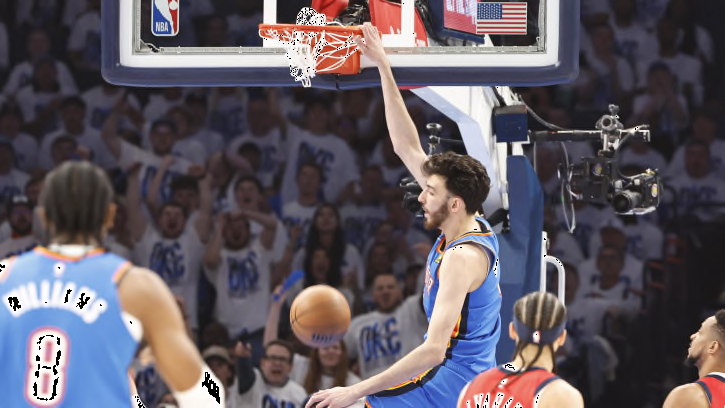
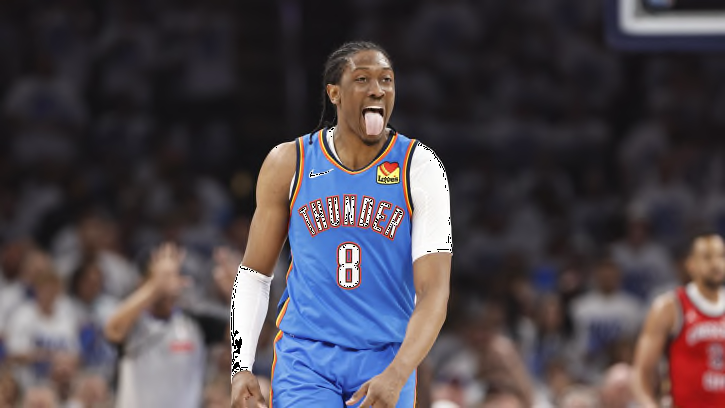
Rookie Chet Holmgren Puts Together Historic Performance in Thunder's Game 2 Playoff Outing
A 20-point first half by Holmgren led Oklahoma City to a tremendous start to Game 2 against the Pelicans.
FSU Football NFL Draft Preview: CB Renardo Green
Green's proven ability in coverage and physical nature should serve him well in his transition to the NFL.
FSU Football NFL Draft Preview: LB Tatum Bethune
Bethune has met with the Tampa Bay Buccaneers and San Francisco 49ers during the predraft process.
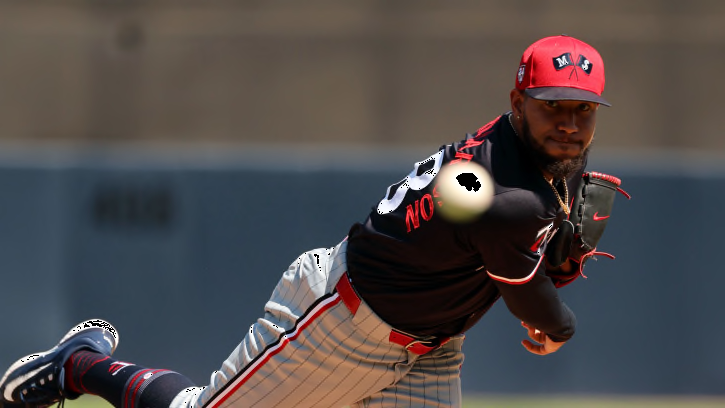
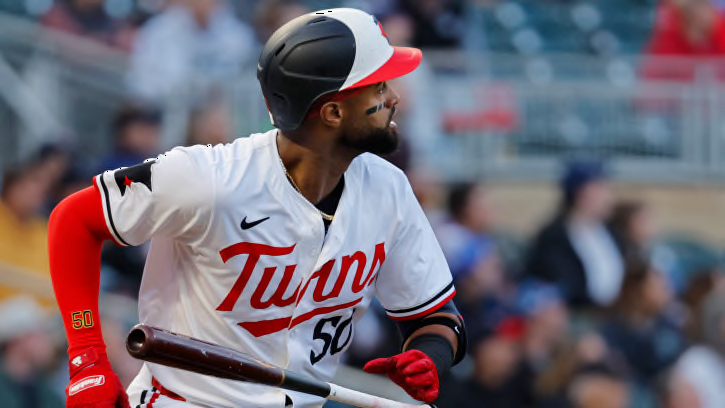
Twins' Simeon Woods Richardson to start series finale against White Sox
Bailey Ober will move back a day and pitch the opener against the Angels.
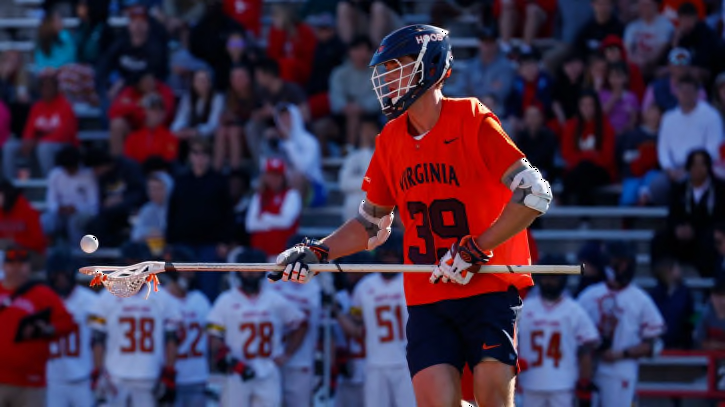
Virginia Lacrosse All-American Cole Kastner Transferring to Play Basketball at Stanford
UVA men's lacrosse All-American defenseman is using his final year of eligibility to transfer to play basketball at Stanford next season.
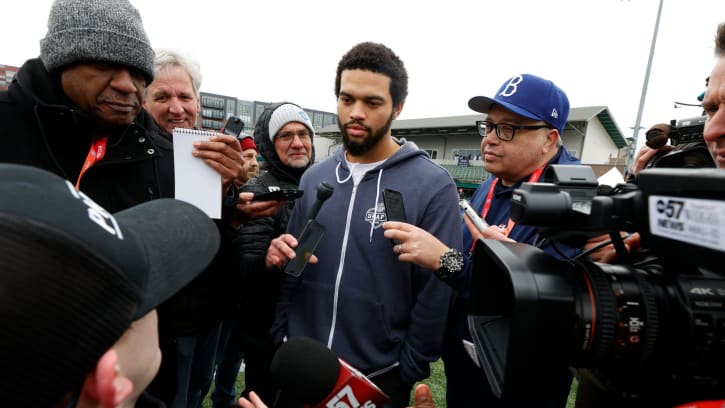
Caleb Williams' Big Day Has Arrived
Analysis: Bears quarterback legacy of disappointment could finally be over if NFL Draft's top pick delivers like at USC.
A Moment with New UW Running Back Jonah Coleman
The new ball carrier talks Fisch culture, his starting debut at the UW and his thighs.
Joe Mazzulla Explains How Miami Heat Held Kristaps Porzingis to Six Points in Game 2
On Wednesday, the Boston Celtics faced a 111-101 loss to the Miami Heat in Game 2. Their first-round playoff series is now tied at 1-1. Kristaps Porzingis scor
USC Guard Taylor Bigby Signs with TCU Women's Basketball
The former four-star recruit played in 34 games at USC last season
Will Trey Hendrickson's Trade Request Impact the Bengals' NFL Draft Plans?
The Bengals have 10 picks in this year's draft.
Michael Harris II Walks Off Marlins in Tenth to Secure Series Sweep for Atlanta
The Atlanta Braves got a scare from the Miami Marlins late but found a way to get the win and secure the sweep
Willi Castro's three-run homer powers Twins to 6-3 win over White Sox
Castro hit the homer and a double on his birthday.
Duke Basketball Officially Adds 7-Footer to Recruiting Class
Projected one-and-done lottery pick Khaman Maluach is now signed on as a 2024-25 Duke basketball big man.
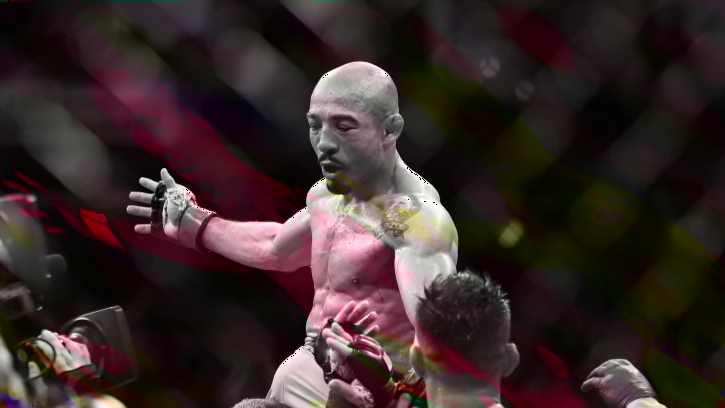
UFC 301 News: José Aldo Reveals Scrapped Return Fight with Fellow UFC Legend
Fans were almost treated to a huge matchup between former champions at UFC 301.
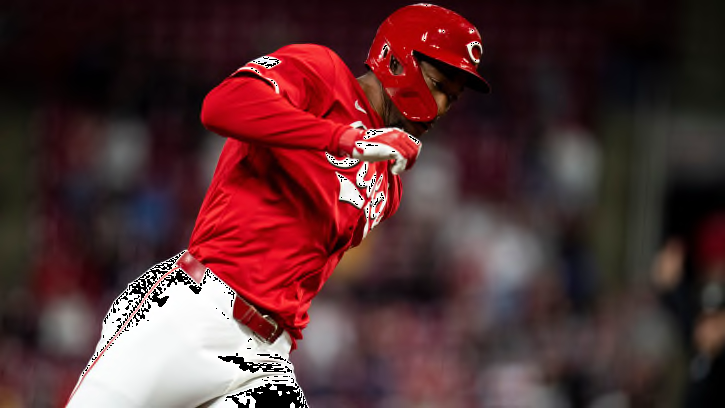
Cincinnati Reds Beat Philadelphia Phillies 7-4 for Second-Straight Win
Cincinnati is 14-10 on the season.
Potential Buccaneers Targets And Best Fits In The Draft: Safety
JC Allen breaks down each position in the draft with potential fits, including the best fits for the Tampa Bay Buccaneers in the NFL Draft.
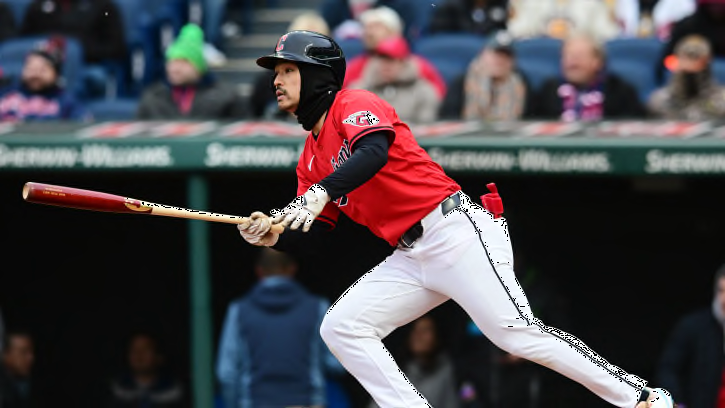
Guardians Rack Up Loud Outs In Loss To Red Sox
The Cleveland Guardians get shut out in four-hit loss to Boston Red Sox.

Texas Rangers Ace Starts Injury Rehab Assignment At Round Rock
Max Scherzer got his first reps of the season against the Salt Lake Bees when he pitched for the Round Rock Express on Wednesday.
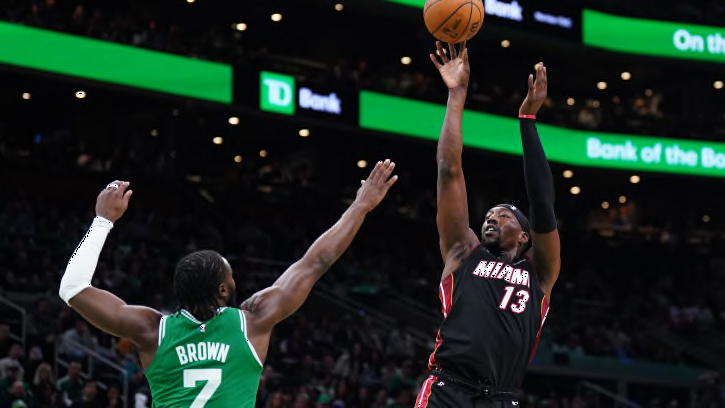
Heat Outmuscle and Outshoot Celtics, Sending Series to Miami Tied at 2
The Miami Heat were the more physical team on Wednesday night at TD Garden. They also flipped the script from Game 1, outshooting the Celtics from beyond the arc to help even the series at one.
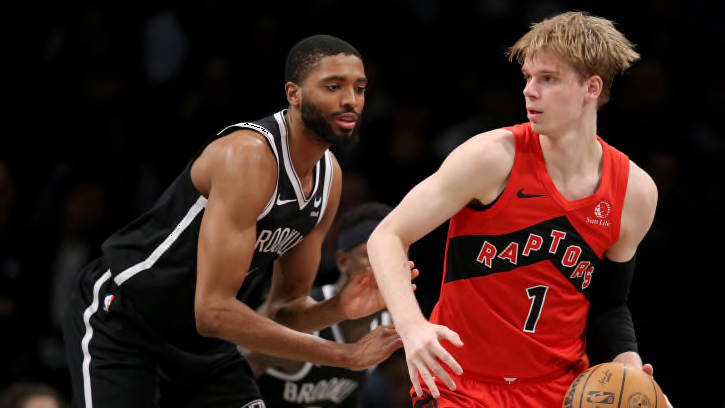
New Nets Head Coach Ready to Compete: ‘We Will See Results Right Away'
Despite a bottom-five finish in the Eastern Conference last season, the Nets new bench boss promises results next season.