
Welcome to FanNation, Part of the Sports Illustrated Media Group
Find and follow your favorite team here. Get the latest news and updates about the team you care most about.
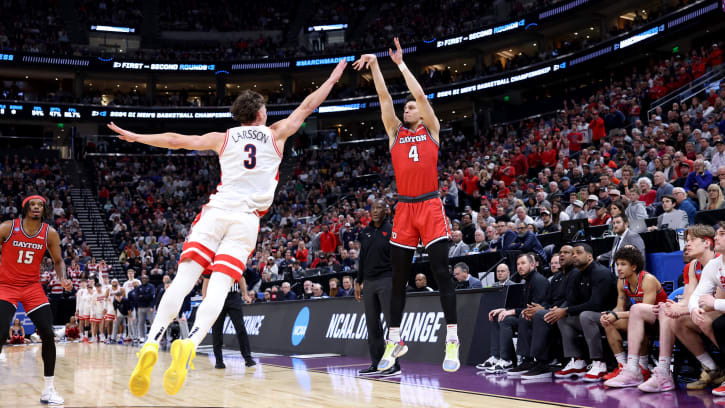
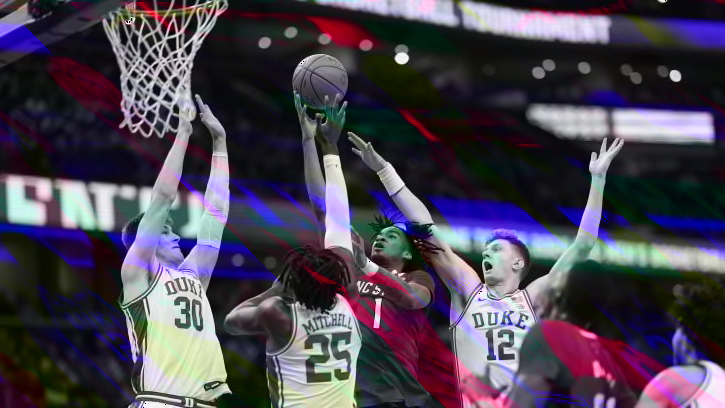
Duke Basketball Appears Among Reported Finalists for Top Sharpshooter
Duke basketball has reportedly moved a step closer in its quest to land a highly sought-after mid-major guard.
Recent Articles
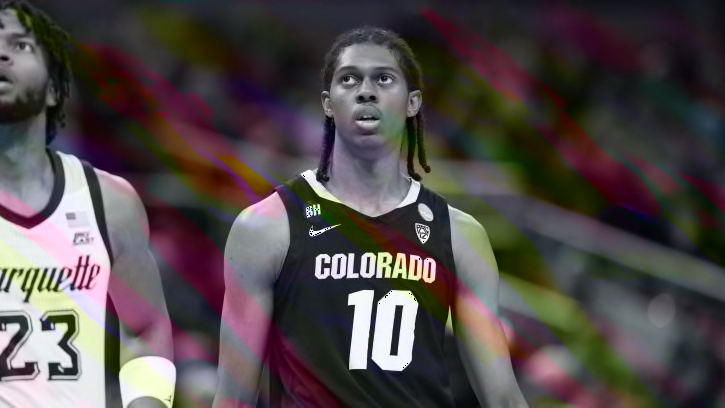
Rockets Draft: The Case for Selecting Cody Williams
In the 2024 NBA Draft, the Houston Rockets should consider selecting Colorado prospect Cody Williams.
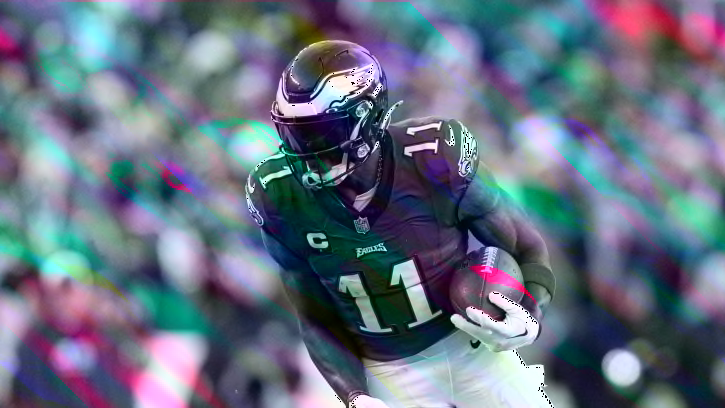
AJ Brown's Cryptic Profile Photo Change Sparks Patriots Whispers
The Philadelphia Eagles wide receiver made a peculiar change to his social media on Thursday.
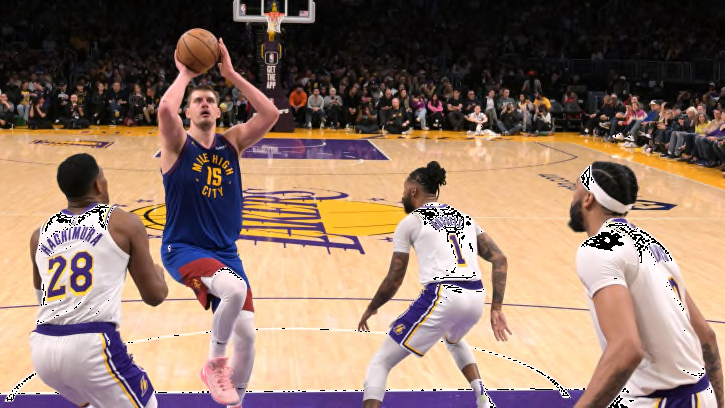
Former NBA Star Makes Controversial Lakers vs. Nuggets Prediction
The Denver Nuggets and Los Angeles Lakers have an exciting series coming up
'If You Want to Be the Best in the World, You Come to Penn State,' Olympic Champ David Taylor Says
Penn State and the Nittany Lion Wrestling Club will be major storylines at the 2024 U.S. Olympic Wrestling Trials at the Bryce Jordan Center.
Tiki Barber Explains Why He Doesn't Want Giants to Select JJ McCarthy at No. 6
Barber implored his old team to think long and hard about selecting Michigan quarterback J.J. McCarthy if he falls to them in the draft order.
How Does Andre Dillard Change Packers’ Draft Outlook?
The Green Bay Packers signed offensive tackle Andre Dillard on Thursday, adding a former first-round pick one week before the 2024 NFL Draft.
Kings’ Playoff Outcome Will Determine 2024 NBA Draft Fate
The play-in game is more than a future playoff date for Sacramento.
Mark Daigneault’s ‘Standard’ Lifting Oklahoma City to New Heights
The Thunder’s head coach expects a lot out of his young team, and it’s paying off in a big way.
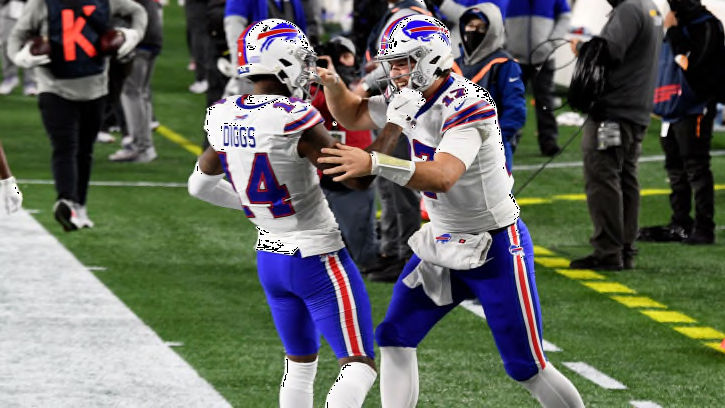
Josh Allen Thanks Diggs For Making Him The QB He Is Today
Allen was clear about the positive impact Diggs had on Allen and The Buffalo Bills
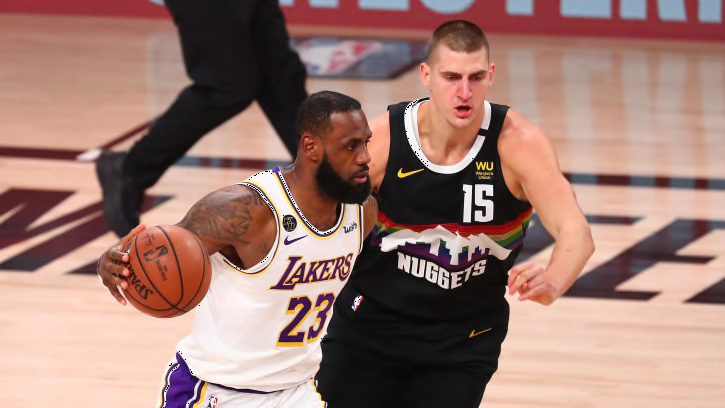
Lebron James Compares Nikola Jokic to Himself and Luka Doncic
LeBron James made a strong comparison.
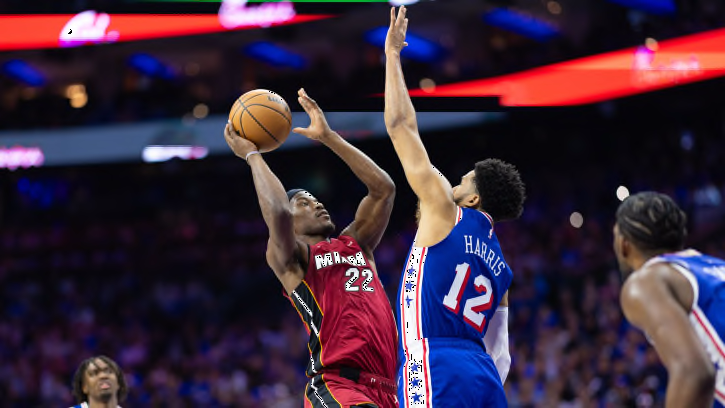
Sixers Coach Explains Tobias Harris' Absence in Crunch Time vs. Heat
Where was Tobias Harris in crunch time?
Notre Dame Is In The Mix With Talented 2027 Quarterback Trae Taylor
Notre Dame is already in the mix for 2027 quarterback Trae Taylor
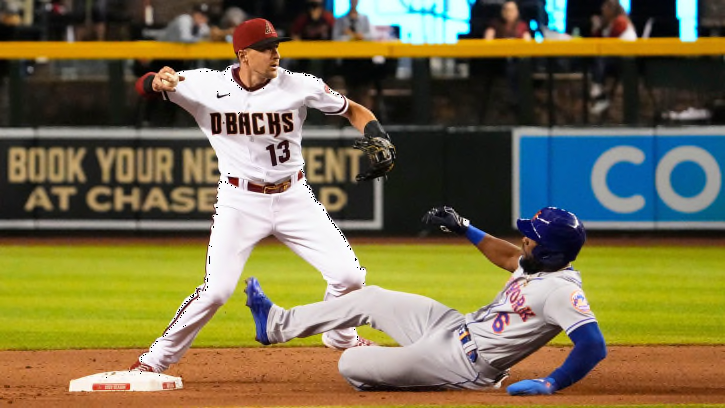
D-backs Face Former Shortstop vs Giants
Arizona travels to the Bay Area to take on Nick Ahmed and the San Francisco Giants.
Jordan Clarkson Sends Message to Jazz Fans Amid Rumors, Uncertainty
What's next for Utah Jazz SG Jordan Clarkson?
Suns Mailbag: Playoffs, Job Security + More
What are some pressing questions for Phoenix going into the postseason?
Six Potential Targets for Oklahoma in the Spring Transfer Portal Window
With the spring transfer portal window now open, the Sooners will have a chance to add depth to a few different spots on their roster.
Major Kawhi Leonard Injury Update News Revealed
Kawhi Leonard's availability for the playoffs has been a major question.
Add Yet Another Duke Basketball Player Exercising Transfer Power
There are now six Duke basketball talents in the portal and not much experience on tap for the 2024-25 Blue Devils.
Cardinals GM Responds to Fans Wanting Marvin Harrison Jr.
Monti Ossenfort side-stepped a question indirectly about Marvin Harrison Jr.
CeeDee Lamb's Projected Contract Extension
Lamb has positioned himself to be one of the NFL's highest paid wide receivers
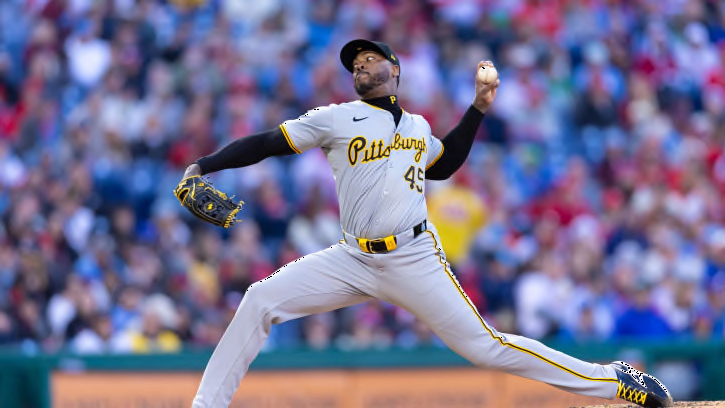
Pittsburgh Pirates Closer Aroldis Chapman Suspended, Fined After Argument With Umpire
After getting ejected from the Pittsburgh Pirates' game against the New York Mets on Monday, All-Star reliever Aroldis Chapman has been suspended for two games.
WWE News: Major WrestleMania Change Reportedly Being Discussed Amid Concerns
WWE's most successful annual show, WrestleMania, may soon be undergoing a welcome change.
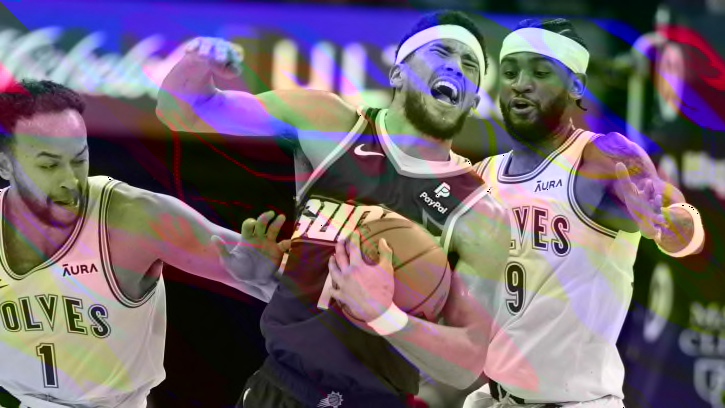
Bold Predictions for Suns vs Timberwolves
What are three outcomes that could surprise people?
New York Giants Draft Preview: WR Roman Wilson
Roman Wilson is an intriguing later round option at receiver. Let's look at his film.