
Welcome to FanNation, Part of the Sports Illustrated Media Group
Find and follow your favorite team here. Get the latest news and updates about the team you care most about.
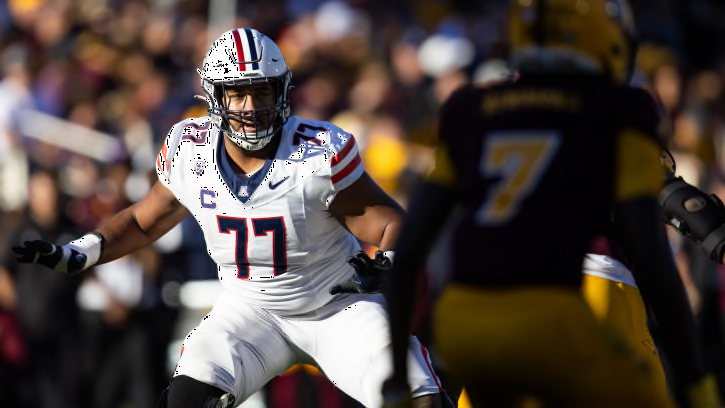
Jordan Morgan’s ‘Heart Stopped’ Upon Being Drafted by Packers
The Green Bay Packers used their first-round pick on Arizona left tackle Jordan Morgan, who was first-team all-conference in 2023 after suffering a torn ACL in 2022.
Recent Articles
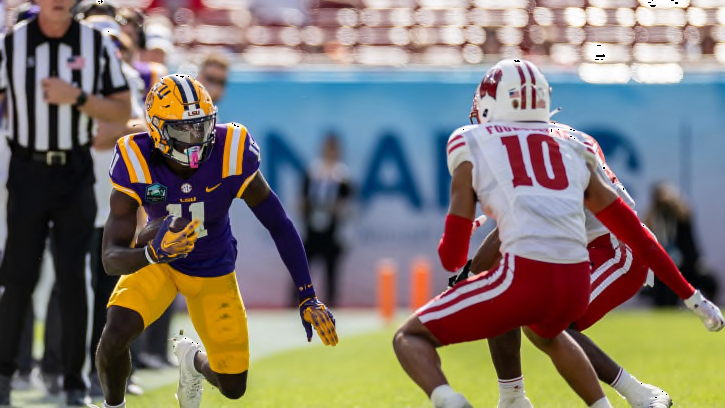
2024 NFL Draft: 3 Observations on Jaguars Selecting Brian Thomas Jr.
What do we make of the Jaguars taking Brian Thomas Jr. at No. 23 overall.

2024 NFL Draft picks by college football team, conference
What college football programs and conferences

Buccaneers GM Jason Licht On Duke First Rounder Graham Barton: "We Had Him Targeted"
Jason Licht had an eye out for Tampa Bay's newest Buccaneer and he was able to grab him.
Lions Fans 'Ecstatic' Terrion Arnold Drafted
Lions fans react favorably to Brad Holmes trading up for Terrion Arnold.
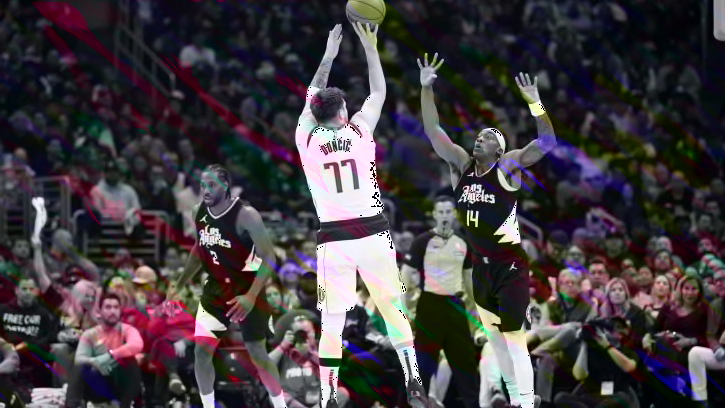
Clippers Trust 'Blueprint' to Stop Luka Doncic's Dallas Mavericks in Playoff Series
The Los Angeles Clippers are confident in their "blueprint" to neutralize Luka Doncic and the Dallas Mavericks in their first-round playoff series.
Bills trade out of first round after deal with Panthers for pick 32
Buffalo swaps Day 3 picks with Carolina to drop down one spot
Cowboys select Oklahoma OT Tyler Guyton with 29th pick
Dallas begins their offensive line retooling in the first round of the draft.

Cowboys gain third-round pick in trade with Lions for pick 24
The Cowboys moved down five spots as Lions trade up for Terrion Arnold
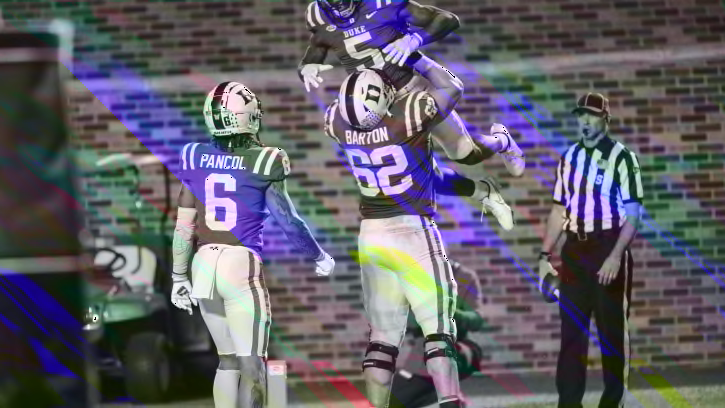
Fans React To Tampa Bay Buccaneers Selecting Duke C Graham Barton in First Round
Fans were stoked about Tampa Bay's newest addition.
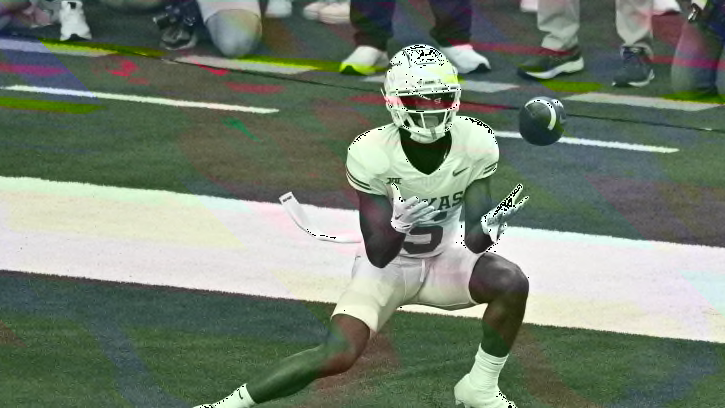
Texas Longhorns WR Adonai Mitchell Falls Out of First Round in NFL Draft
Texas Longhorns receiver Adonai Mitchell will have to wait until the second round to be officially drafted.
Mostly Positive Reviews for Robinson Selection
The Miami Dolphins made Penn State edge defender Chop Robinson the 21st overall selection
Trade! Panthers Move Into First Round to Select WR Xavier Legette
Carolina gets Bryce Young another weapon.
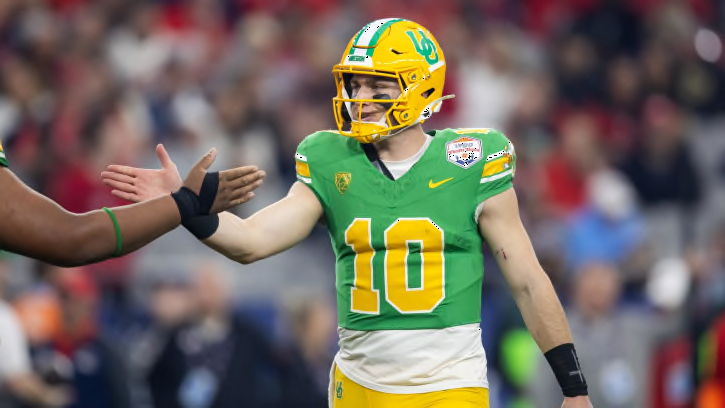
Sean Payton Reveals Why Denver Broncos Drafted 'Super Intelligent' Bo Nix
Sean Payton discusses the Denver Broncos' decision to draft Bo Nix, highlighting his intelligence and potential impact on the team.
What Did The Browns Division Rivals Do In First Round Of NFL Draft?
Without a first round pick, the Browns watched the Bengals, Steelers and Ravens all make first round selections.
Social Media Posts Sum Up Surprising Buffalo Bills' Trade
The Buffalo Bills traded back in the first round at the NFL Draft, gifting Texas speedster Xavier Worthy to the Kansas City Chiefs in the process and sparking social media criticism.
2024 NFL Draft tracker: Complete results, list of picks for Round 1
Tracking every pick made in Round 1 of the 2024 NFL Draft.
Grading Lions' Selection of Terrion Arnold
All Lions provides its grade for Detroit's selection of Alabama cornerback Terrion Arnold.

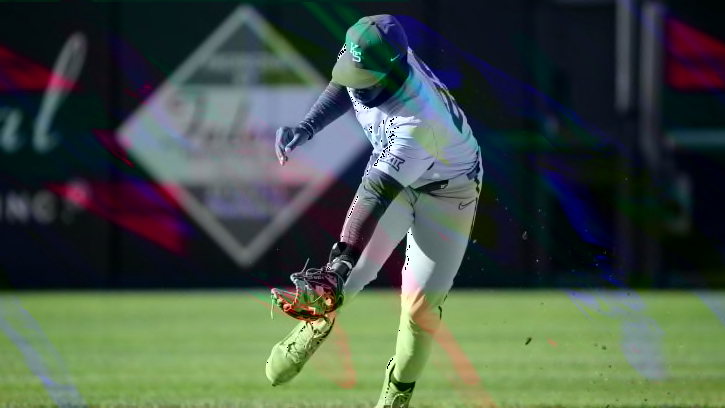
Virginia Baseball Falls to Boston College 8-2 at Fenway Park
UVA baseball matched a season-low with two runs scored in a disappointing loss to Boston College in the annual ALS Awareness Game at Fenway Park.
Bucks star Giannis Antetokounmpo still recovering from calf injury with Game 3 vs Indiana Pacers approaching
Antetokounmpo hasn't appeared in the series yet
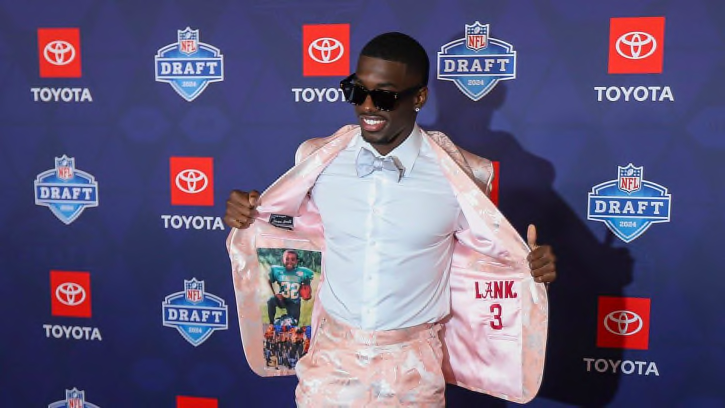
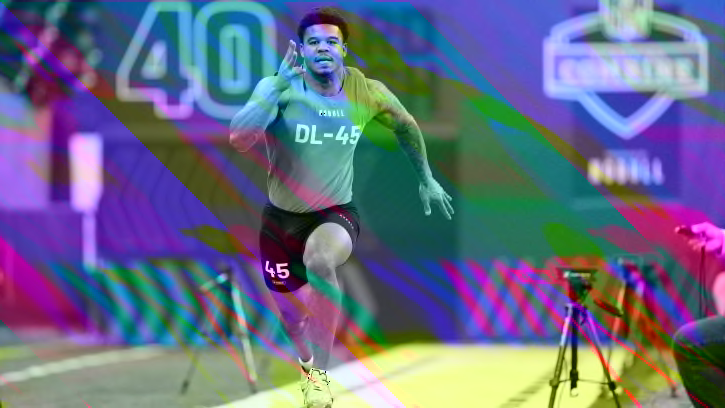
Cardinals, NFL React to Second First-Round Pick
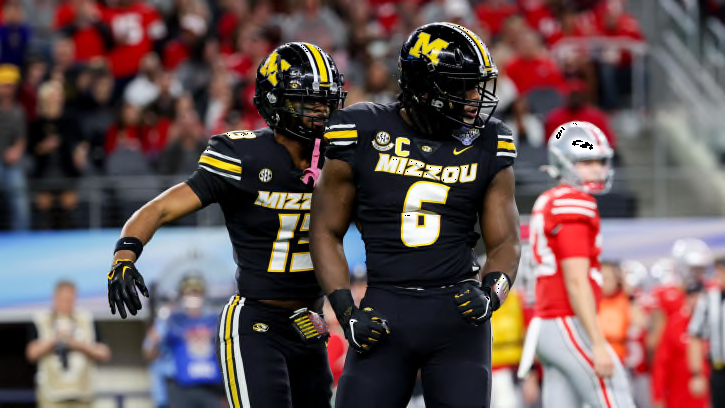
The Arizona Cardinals walked away with a dominant defensive lineman in Darius Robinson.
Vikings GM Kwesi Adofo-Mensah Refutes ESPN's Justin Herbert Report
Adofo-Mensah was surprised to hear the report that the Vikings inquired about Herbert.
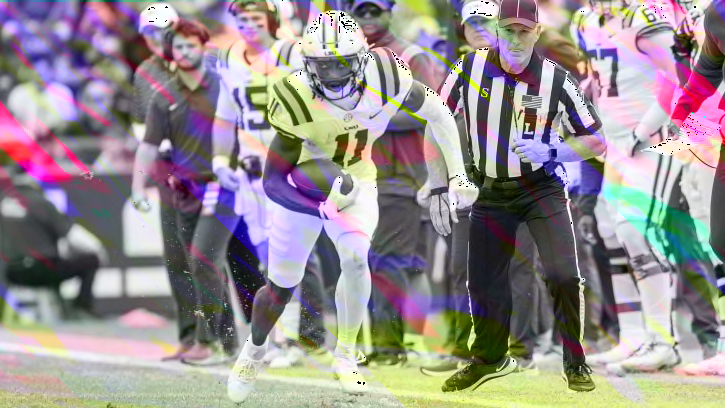
Jaguars Draft Brian Thomas Jr. at No. 23, Traded for Texans' Original Pick
The Jacksonville Jaguars drafted wide receiver Brian Thomas Jr. with the No. 23rd selection, which was originally held by the Houston Texans.
Know Your Foe: Kansas State Baseball Players to Watch
Key players from Kansas State you will need to know when they take on the TCU Horned Frogs this weekend.